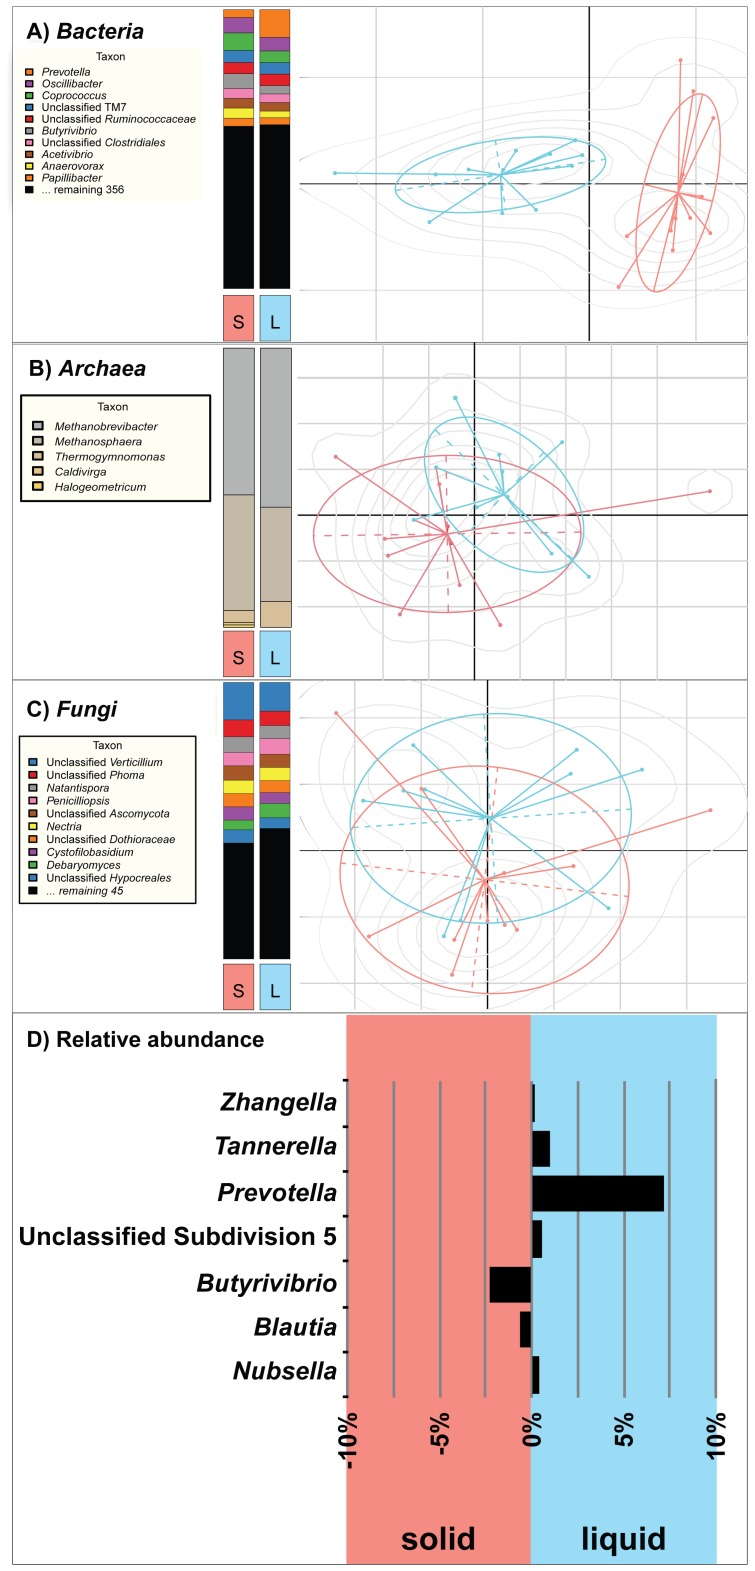
Figure 3. Comparison of microbial diversity in bovine rumen solid (S) and liquid (L) fractions in 12 cows.
Bar-charts (left panels) and PCA scatter plots (right panels) display the OTU-based taxonomic profiles and similarity among profiles, respectively for Bacteria (A), Archaea (B), and Fungi (C). The relative abundance of seven bacteria with significant differences in liquid and solid fractions of the rumen was plotted (D).

