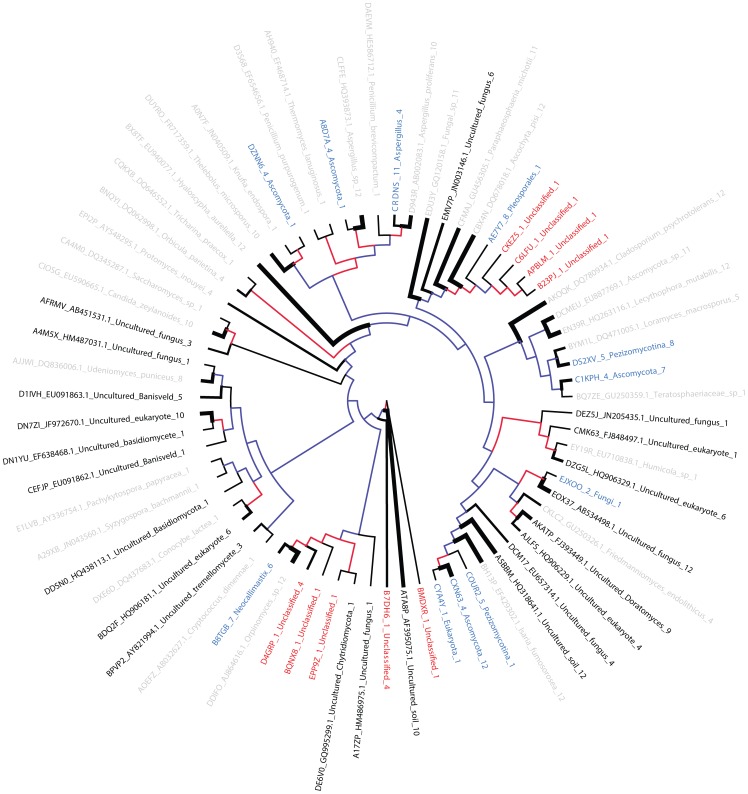
Figure 5. Phylogenetic diversity of fungal 18S rRNA sequences in bovine rumen.
NJ tree clustering of OTU representatives labeled based on similarity to known sequences. The color of the branch indicates bootstrapping value: blue when bootstrapping was <50%, red when bootstrapping was >50%. The width of the branch is proportional to the number of animals (1–12) that exhibited a given OTU. This number of animals is also indicated in the last part of the OTU label. Gray- and black-labeled OTUs were classified using BLAST and at least 97% identity to a target sequence. Black labels highlight a subset of these OTUs with vague annotation. OTUs labeled in blue did not match a target using BLAST, but were subsequently classified using LCA based on 90% identity to a SILVA database match. OTUs in red failed both BLAST and LCA and are presumably novel taxa.

