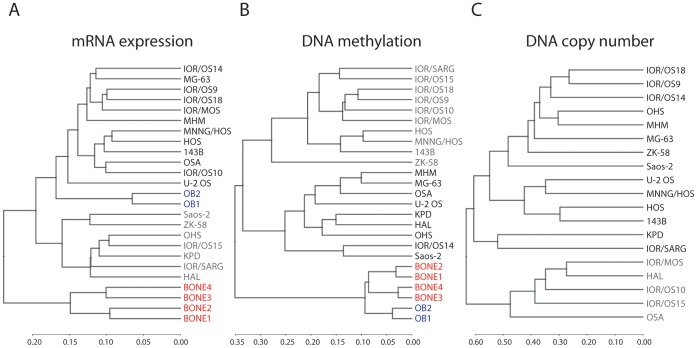
Figure 1. Hierarchical clustering of osteosarcoma cell lines and normal samples.
Dendrograms from unsupervised hierarchical clustering of the osteosarcoma cell lines, normal bone and normal osteoblast samples based on genome-wide (A) mRNA expression (vst transformed and quantile normalised probe intensities), (B) DNA methylation (probe beta values) and (C) DNA copy number (probe intensities). The osteosarcoma cell lines have been colour-coded in gray and black, highlighting the two main subclusters, the normal bone samples in red and the normal osteoblast samples in blue. The clusters were made using Spearman correlation as distance measure and complete linkage.

