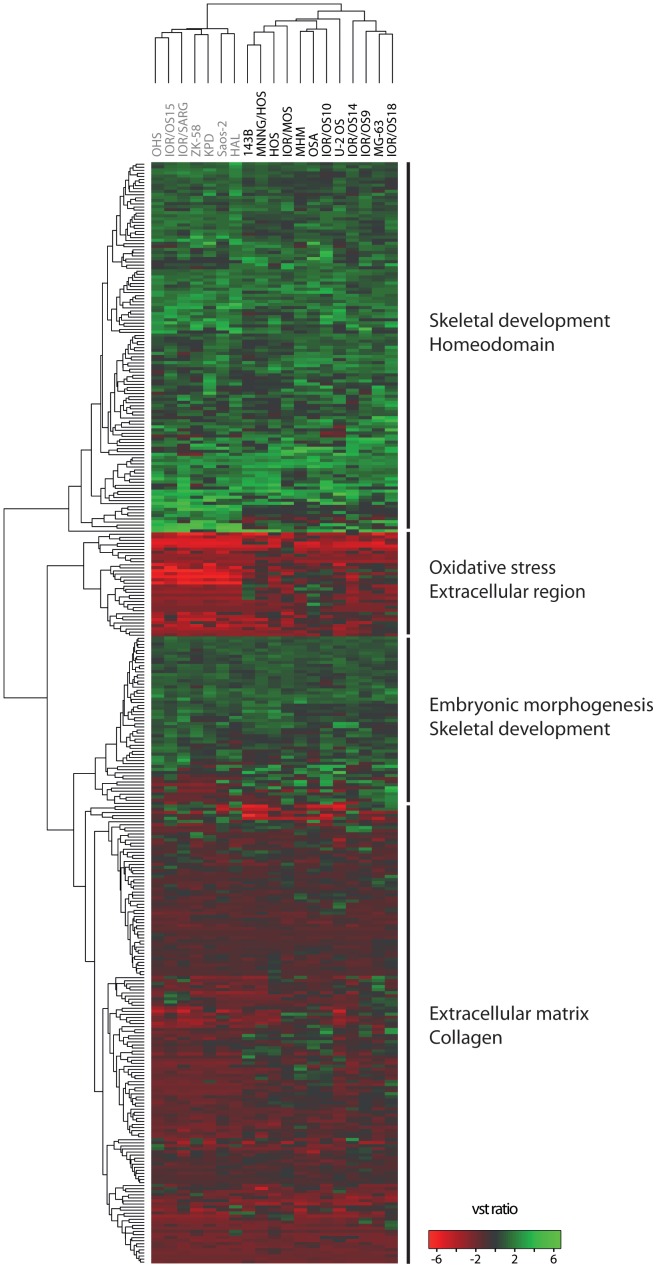
Figure 6. Hierarchical clustering based on 350 genes that recurrently showed two types of aberrations.
Hierarchical clustering of the osteosarcoma cell lines based on the expression level of the 350 genes that recurrently showed two types of aberrations. The main terms from functional enrichment analysis using DAVID is indicated for each main subcluster of genes. The cell lines are colour-coded in gray and black according to the separation into two main subclusters from the unsupervised hierarchical clustering based on the global mRNA expression (Figure 1A). The cluster was made using Euclidian as distance measure and complete linkage. Green, increased gene expression; red, decreased gene expression.

