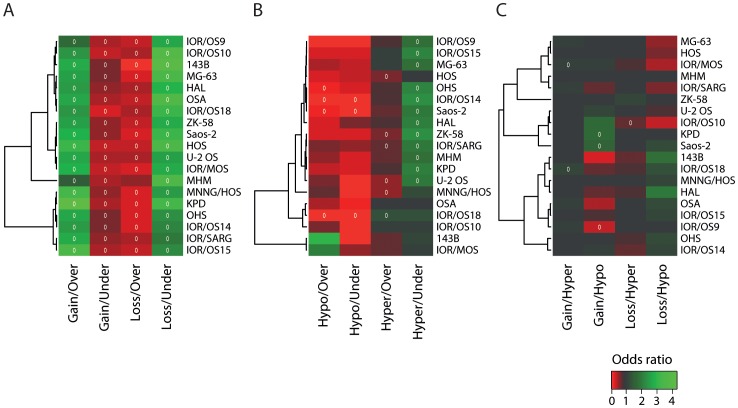
Figure 7. Data dependencies for two-way combinations.
Heat map plots visualising the odds ratio and significance of data dependencies, with unsupervised hierarchical clustering of the cell lines, for two-way combinations of (A) DNA copy number and gene expression, (B) DNA methylation and mRNA expression and (C) DNA copy number and DNA methylation. The colours of the heat map plot represent the odds ratio for a gene of having one type of aberration given that it has another type of aberration. Green, positive association (odds ratio >1); black, no association (odds ratio = 1) and red, negative association (odds ratio <1). A white circle indicates significance (Benjamini & Hochberg-corrected chi-square p-value <0.05).

