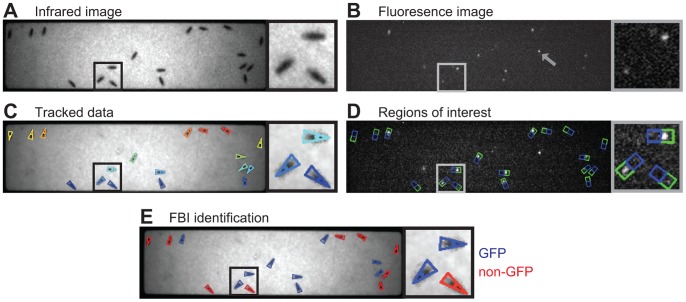
Figure 2. Processing of video images to yield genetic identities in heterogeneous groups of Drosophila. A).
Infrared backlit image of a genetically heterogeneous group of flies. Black box indicates the inset to the right of the image. B) Fluorescence image of the same group of flies. Grey box indicates inset. Note that extraneous autofluorescence from the experimental arena (grey arrowhead) does not impede subsequent analysis. C) Infrared image overlaid with size, position and orientation tracking data acquired using Ctrax [2]. Each colored triangle corresponds to a single fly. D) Fluorescence image overlaid with Regions of interest (ROIs). Green boxes encompass Front ROIs and blue boxes Rear ROIs for each fly. E) Infrared image overlaid with FBI data identifying each fly as GFP (blue) or non-GFP (red).

