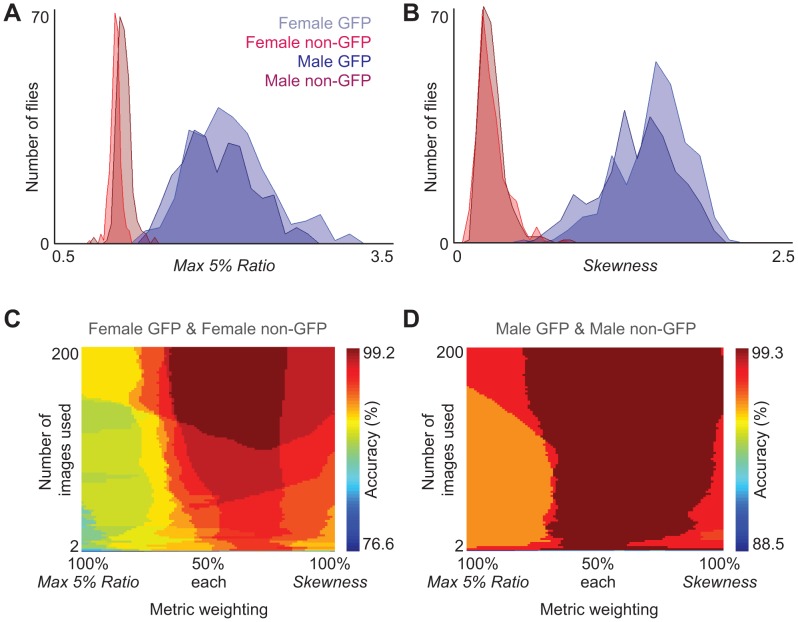
Figure 3. Best fluorescence discrimination metrics and their accuracy landscapes when used in combination.
A) Histograms of the Max 5% Ratio metric for GFP females (light blue, n = 270 flies), non-GFP females (red, n = 267 flies), GFP males (dark blue, n = 270 flies), non-GFP males (dark red, n = 268 flies). Here the mean of the maximum 5% pixel values in the Front ROI is divided by the mean of the maximum 5% pixel values in the Rear ROI. Data is taken from homogeneous group experiments. B) Histograms of the Skewness metric for the same dataset. Here the skewness of pixel value distributions in each Total ROI is measured. C) Fluorescence discrimination accuracy of heterogeneous groups of female flies (n = 14 experiments; GFP females, n = 123; non-GFP females, n = 125) or D) male flies (n = 15 experiments; GFP males, n = 142; non-GFP males, n = 136). Here the number of flies expected in each genotype is incorporated into the genotype discrimination algorithm. X-axes show the weighting of each metric. Y-axes show the cumulative number of images averaged for metric measurements. Color bars indicate the discrimination accuracy.

