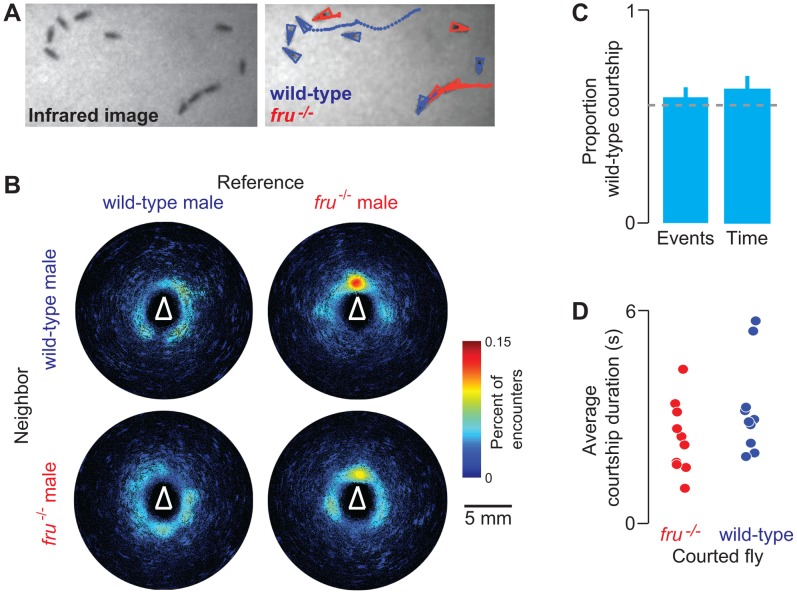
Figure 4. FBI analysis of courtship interactions among mixed groups of fruitless (fru−/−) and wild-type males. A).
Raw (left) and Ctrax/FBI (right) images of courtship interactions between wild-type GFP males (blue) and fru−/− non-GFP males (red) (flies are trailed by colored dots indicating their position in the previous 50 images/2.5 s). Three flies at the bottom-right form a courtship chain, as fru−/− mutants court other males. B) Encounter density heat maps for wild-type reference flies with respect to other wild-type neighbors (top-left), fru−/− reference flies with respect to wild-type neighbors (top-right), wild-type reference flies with respect to fru−/− neighbors (bottom-left), and fru−/− reference flies with respect to fru−/− neighbors (bottom-right); n = 10 experiments; 60 fru−/− flies and 60 GFP flies. Color bar indicates the percent of encounters observed at a given pixel. White triangles denote the orientation and approximate size of reference flies. C) Bar plots indicating the proportion of fru−/− courtship events and courtship time towards wild-type flies (n = 10 experiments, mean and s.e.m.; chance based on the proportion of wild-type flies indicated in grey dashed line). D) The average duration of each courtship event of fru−/− flies (n = 10 experiments) towards fru−/− males (red) or wild-type males (blue).

