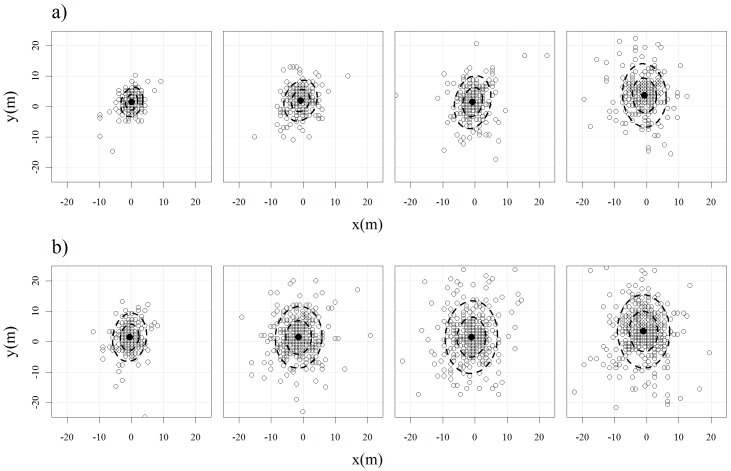
Figure 2. Positional error (m) of stationary collars placed in varying percentages of canopy cover in the Town of Spafford, New York from mid-February to mid-March 2008 for two different fix schedules: a) 5 hr and b) 30 min.
Dashed lines represent the 50% and 90% normal ellipse contours of position densities. Percent canopy cover increases from left to right (0–25%, 26–50%, 51–75%, 76–100%).

