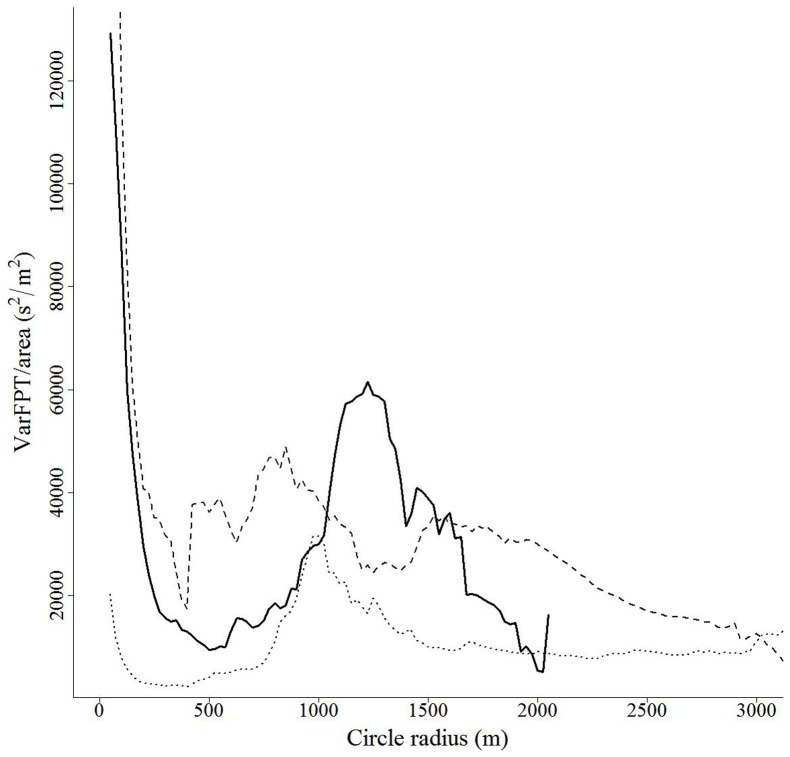
Figure 5. Plots of area adjusted variance in first-passage time (varFPT/area, s2/m2) as a function of the extent used to determine passage time along the observed movement path (radius of circle, m) for 3 white-tailed deer in central New York.
Peaks in varFPT/area indicate the landscape scale(s) to which individuals are responding by altering time spent along their movement path.

