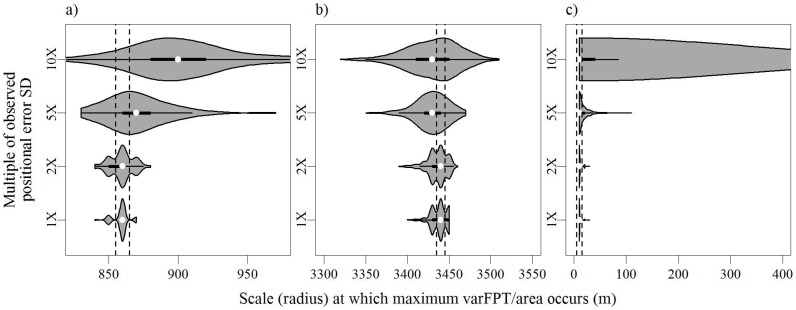
Figure 6. Violin-box plots displaying the impact of habitat-specific positional error on medium-(A), large-(B), and small-scale (C) peaks in varFPT/area for 500 simulated movement paths of white-tailed deer in central New York in 2006–2007.
Dashed lines indicate the location of the peak in varFPT/area for the observed path (resolution = 10 m).

