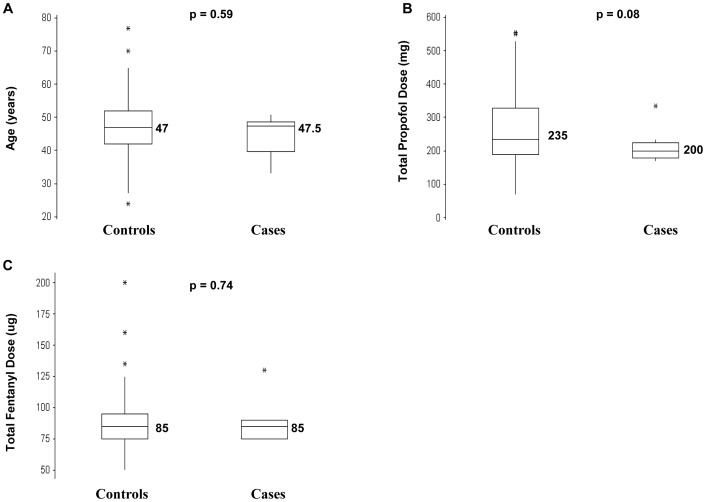
Figure 3. Boxplots indicating the distribution of values for 3 variables in 151 controls and 10 cases.
These 3 variables could contribute to the occurrence of emesis but could not be controlled for in the study design (a) Age (b) Total propofol dose (c) Total fentanyl dose. The median is the horizontal line bisecting the shaded box of the boxplot and the median value placed adjacent to the horizontal line. There are no significant differences (p<0.05) between the median values of controls and cases for the 3 variables.

