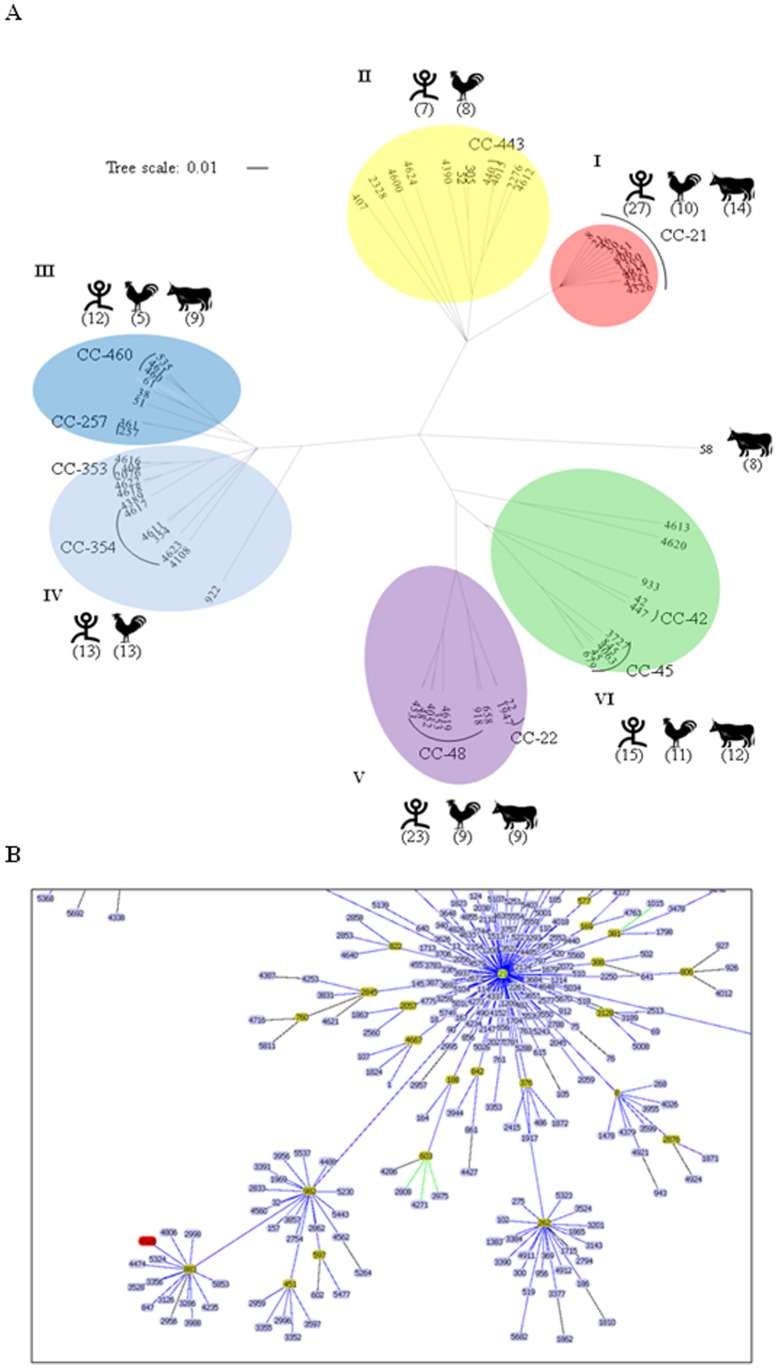
Figure 2. Genetic population and phylogeography of the C. jejuni MLST dataset.
(A) The ClonalFrame analysis data for the 62 STs in the 212 C. jejuni isolates in Japan. The numbers of isolate sources per subgroup (cluster I to VI) are shown in the parenthesis, with illustrations (human, poultry, and cattle). (B) Enclosed graphic for the Global Optimal eBURST (goeBURST) analysis of C. jejuni CC-21 to assess the clonal lineage of ST-4526 (red) from the ancestor ST-21. The entire data is shown in supplemental Figure S1.

