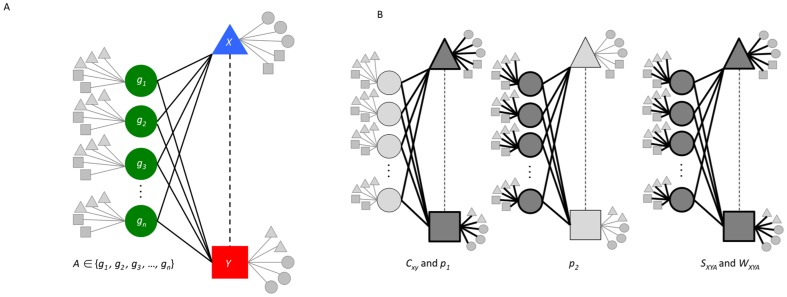
Figure 1. Transitive chemical-disease inferences and the computational approaches used to score inferences.
A) Diagram of local network for the transitive chemical-disease inference (dotted line) between a chemical, X, and a disease, Y, using a set of genes, A, that have both curated chemical-gene interactions and gene-disease associations (solid lines). The chemical, disease and each gene involved have interactions and relationships to other nodes (chemicals, genes, diseases) in the database. Chemical X has some number of other genes (grey circles) that it interacts with and associated diseases (grey squares). Disease Y has other associated genes and curated relationships to other chemicals (grey triangles). Each gene used to make the inference, g1 to gn, are known to interact with other chemicals (grey triangles) and are associated with other diseases (grey squares). B) Diagrams showing three methods to score inferences. The first, CXY and p1, is based on the number of genes (circles) used to make the inference and the connectivity (bold lines) of the chemical (triangle) and disease (square). The second, p2, takes the number of genes (circles) used to make the inference and their connectivity (bold lines) into account. The third, SXYA and WXYA, takes the number of genes into account as well as the connectivity of the chemical, disease and each of the genes into account.

