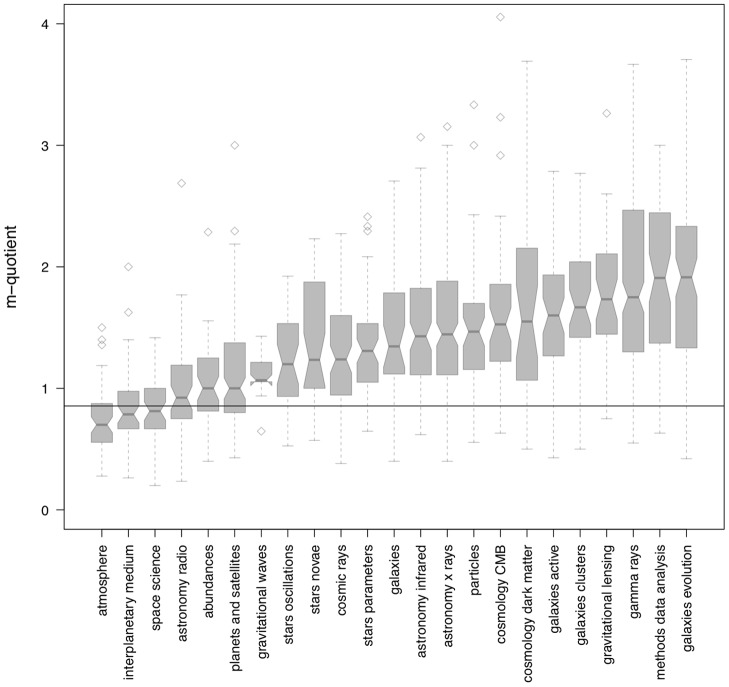
Figure 2. Distribution of astronomers' m-quotients as function of field of specialization.
Each field includes between 30 and 150 astronomers who began their career in the 1990s. The box-and-whisker plot of each field depicts the median (middle notch), lower and upper quartiles (lower and upper hinges), minimum and maximum values (lower and upper whiskers), and outliers.

