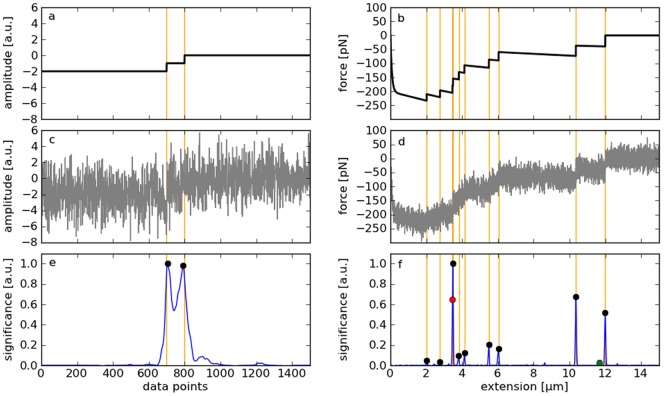
Figure 1. Evaluation of the MSF algorithm.
a: Synthetic test signal containing two steps of height one separated by a defined distance (data set A). b: Artificial AFM spectrum generated by Monte Carlo simulations mimicking an idealized (noise-free) force-distance curve typically obtained by cell adhesion measurements (data set B). c: Clean signal superimposed by normal-distributed white noise. d: Clean signal superimposed by random AFM noise with a standard deviation of 20 pN. e, f: Indicator of possible step positions calculated from the noisy signals by the MSF algorithm (blue). Local maxima are used to identify the steps (see methods). Orange lines mark the true step positions, black dots correct detections, the green dot a false-positive, and the red dot a false-negative.

