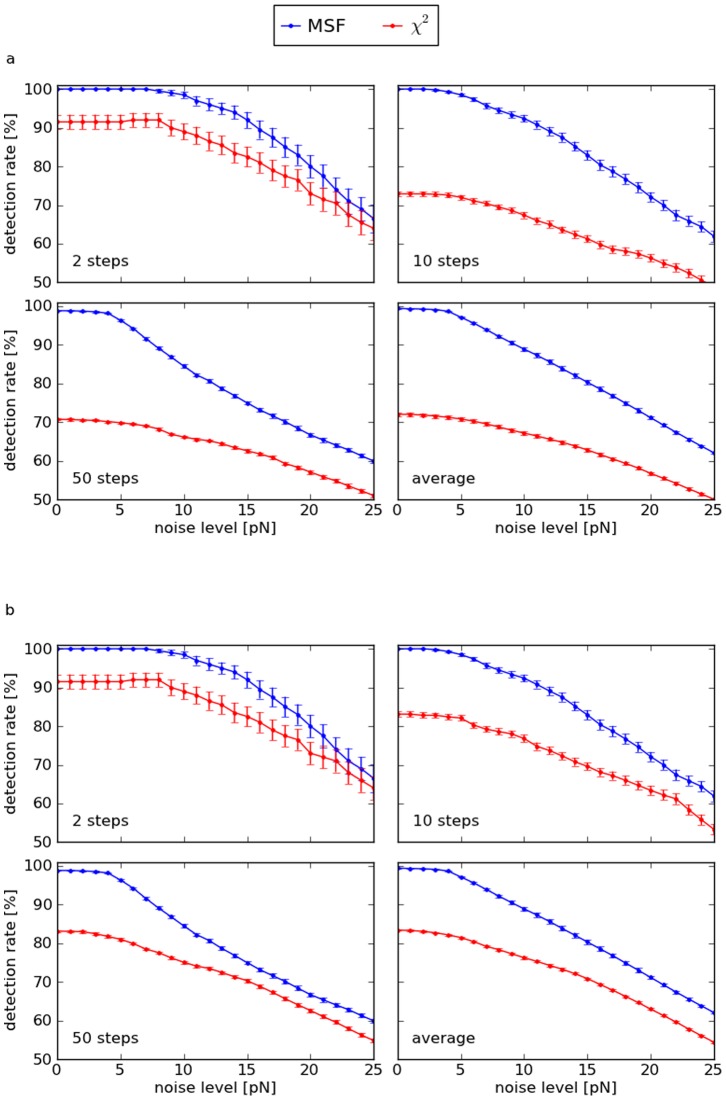
Figure 2. Detection rates vs. noise amplitudes of the MSF and the method applied to synthetic test signals.
Every marker represents the average rate over 100 curves with distinct random noise, with error bars indicating the standard errors. a: Two steps of height one separated by a variable distance (data set A, see example in fig. 1c). The last plot shows the average detection rates over 33 step distances between 40 and 1000 data points. Detection parameters were optimized for the constant SNRs and distances of the steps. b: Artificial force curves generated by Monte Carlo simulations with varied number of steps (data set B, see example in fig. 1d). Parameter optimization was performed for each noise level and number of steps. The last plot shows the average detection rates over the range of 2, 3, …, 50 steps.

