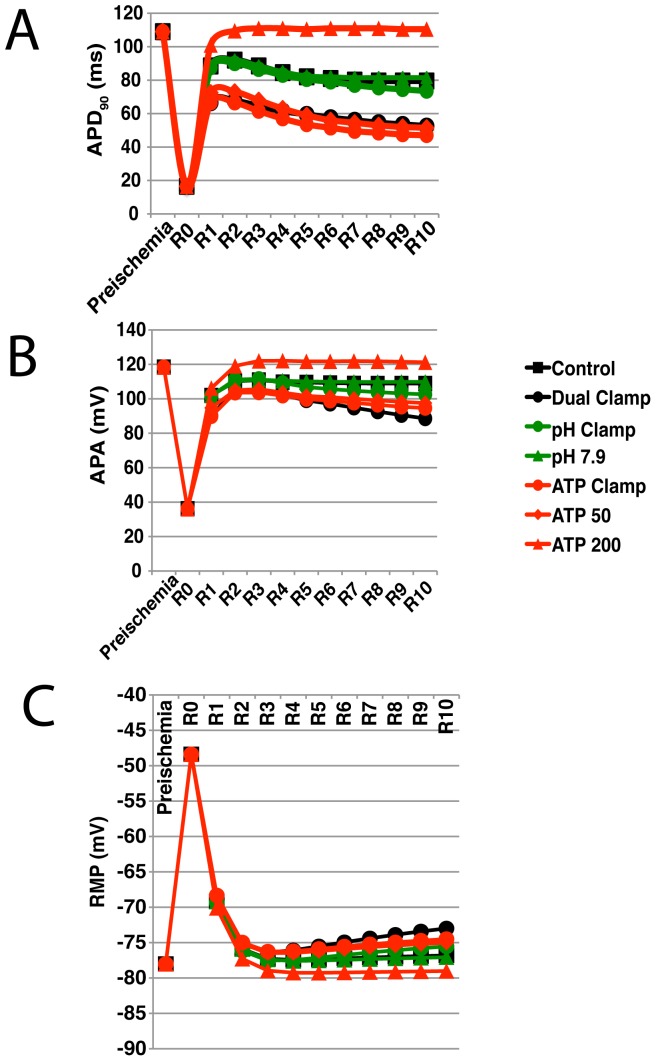
Figure 4. Action potential duration (90), action potential amplitude, and resting membrane potential during simulated reperfusion.
The evolution of action potential duration (90) ( ) (A), action potential amplitude (APA) (B), and resting membrane potential (RMP) (C) throughout reperfusion are shown for the subset of simulations shown in Fig. 3. Values recorded at the end of preischemia, at the beginning of reperfusion (R0), and once per minute of reperfusion (R1–R10) are shown. Control and Dual Clamp simulations are represented by black squares and circles, respectively. pH Clamp and pH 7.9 simulations are represented by green circles and triangles, respectively. ATP Clamp, ATP 50, and ATP 200 simulations are represented by red circles, diamonds, and triangles, respectively. Simulations were performed using a pacing rate of 3 Hz. Results for the full set of 3 Hz simulations can be found in Text S1.

