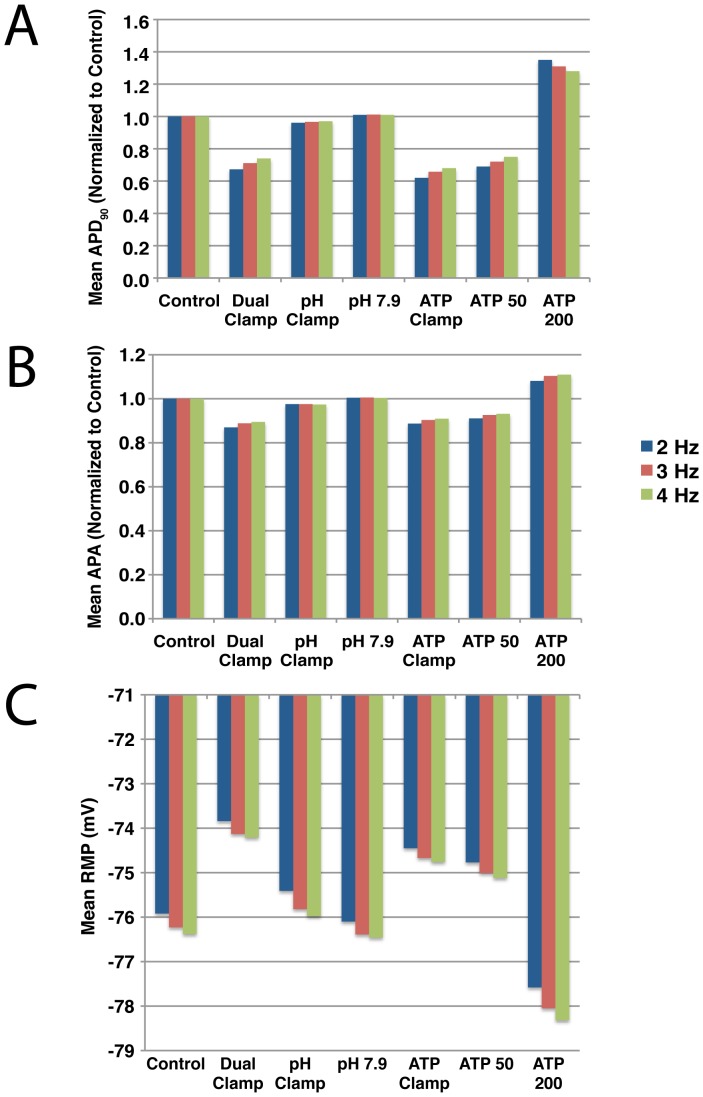
Figure 6. Mean  , APA and RMP during reperfusion.
Each of the seven simulation protocols summarized in Fig. 3 were run at three pacing rates: 2 Hz (blue), 3 Hz (red), and 4 Hz (green). For each simulation, the mean APD (A), APA (B), and RMP (C) were calculated for the 10 minutes of reperfusion. For each pacing rate, the mean  and APA values are normalized to the control simulation. Mean values for the full set of simulations that were run using a pacing rate of 3 Hz can be found in Text S1.

