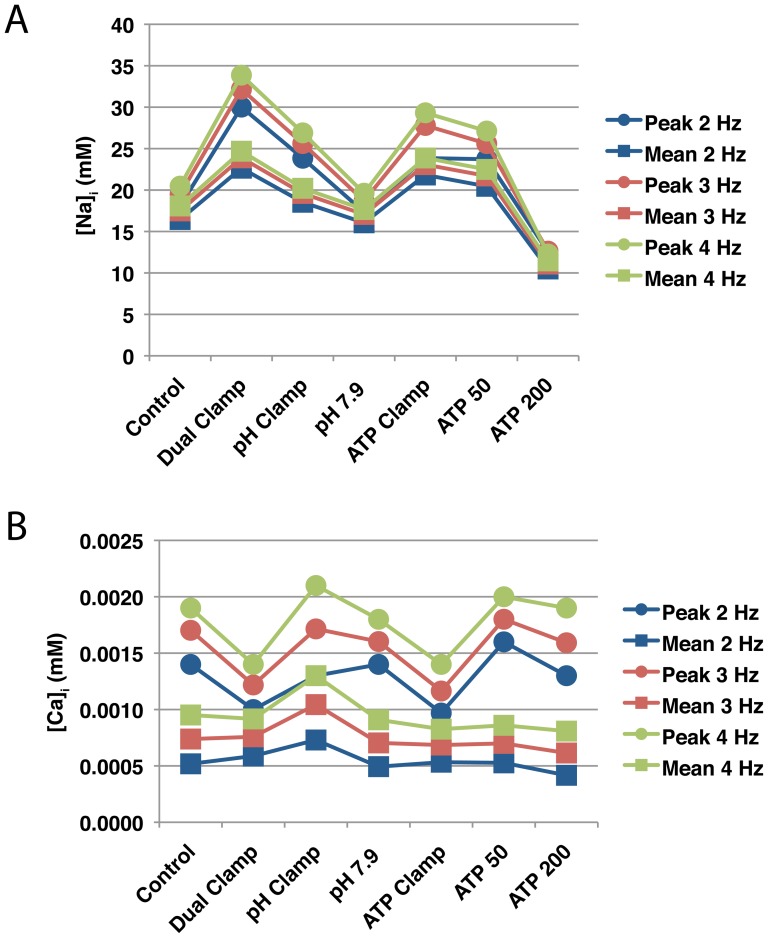
Figure 8. Sodium and calcium concentrations during simulated reperfusion.
Each of the seven simulation protocols summarized in Fig. 3 were run using three pacing rates: 2 Hz (blue), 3 Hz (red), and 4 Hz (green). For each simulation, the peak (circles) and mean (squares) concentrations of intracellular sodium (A) and calcium (B) were recorded during reperfusion. Results for the full compliment of 3 Hz simulations can be found in Text S1.

