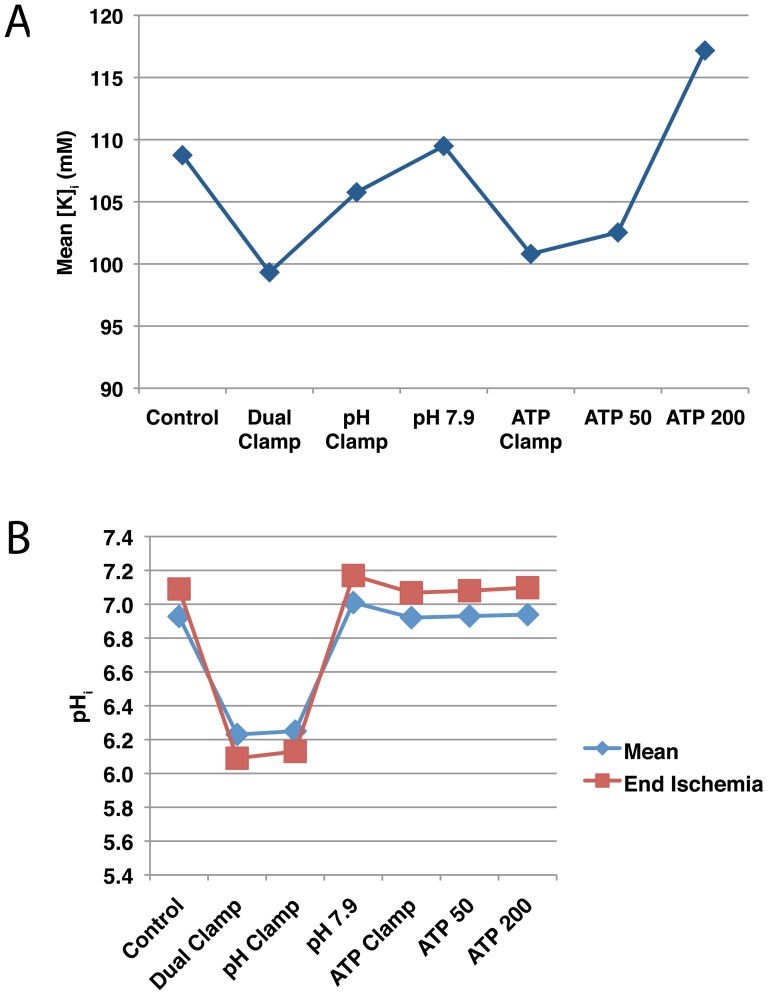
Figure 9. Intracellular pH and potassium concentrations during simulated reperfusion.
(A) Mean intracellular potassium concentrations. (B) Mean intracellular pH (blue diamonds) and pH after 10 minutes of reperfusion (red squares). These simulations (summarized in Fig. 3) were run using a pacing rate of 3 Hz. Full results can be found in Text S1.

