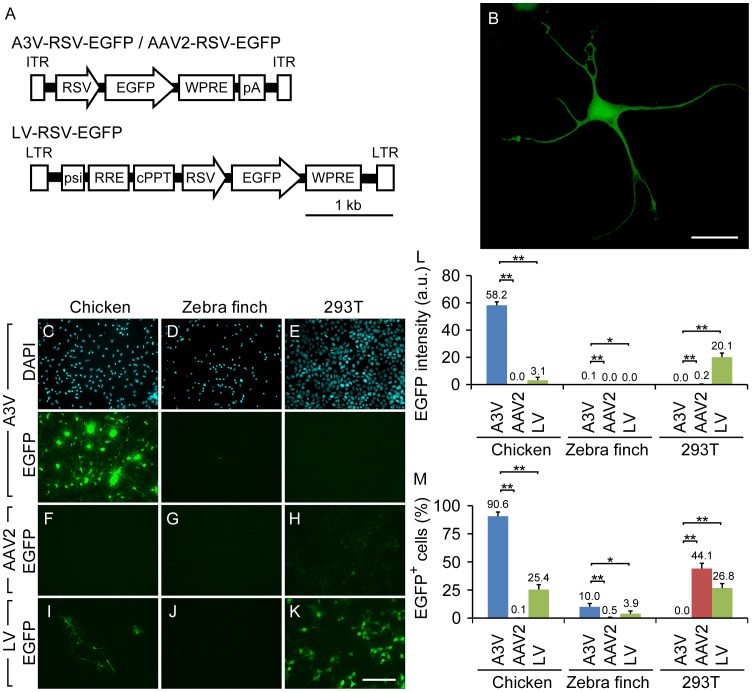
Figure 1. Comparison of transduction properties of A3V, AAV2 and LV.
(A) Constructs of A3V-RSV-EGFP, AAV2-RSV-EGFP, and LV-RSV-EGFP. ITR, inverted terminal repeat; RSV, Rous sarcoma virus promotor; EGFP, enhanced green fluorescent protein; WPRE, woodchuck hepatitis virus post-transcriptional regulatory element; pA, SV40 polyadenylation signal; LTR, long terminal repeat; psi, packaging signal; RRE, Rev-responsive element; cPPT, central polypurine tract. (B) A representative example of EGFP-expressing cultured chicken neural cells after A3V treatment. Scale bar indicates 20 µm. (C–E) A3V-treated chicken neural cells, zebra finch neural cells, and 293T cells, respectively. Upper and lower panels represent the DAPI nuclear staining and EGFP fluorescent images of the same fields of view, respectively. All fluorescent images were taken with the same exposure time. (F–K) As a comparison, fluorescent images of corresponding cultured cells after AAV2 or LV treatment are shown. All images were taken with the same exposure condition as in (C–E). Scale bar indicates 100 µm. (L and M) Quantification of overall gene expression and transduction rate, respectively (n = 4). a.u., arbitrary units. *p<0.05; **p<0.005. The raw data are listed in Tables S1 and S2.

