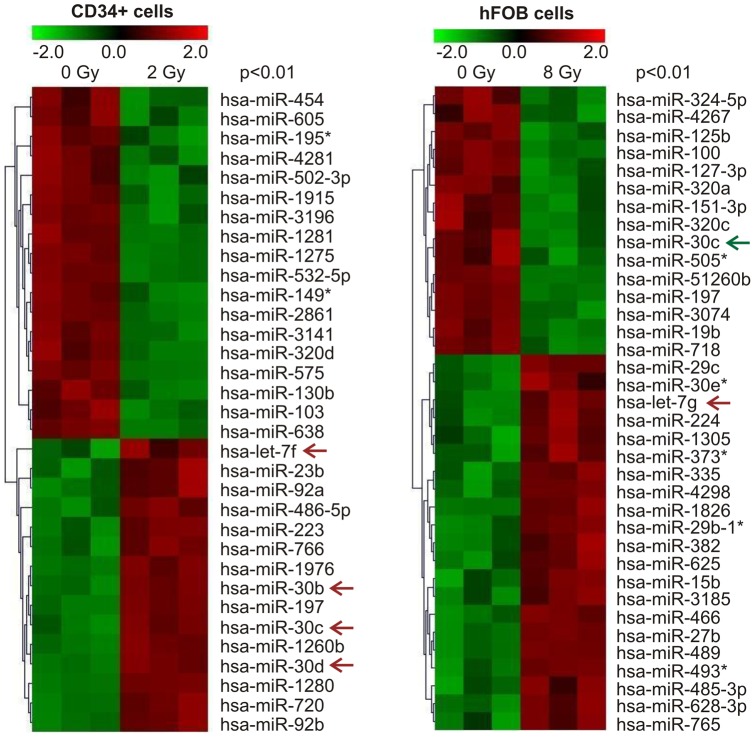
Figure 1. Differentially expressed miRNAs in human hematopoietic and osteoblast cells following exposure to γ- radiation.
Human hematopoietic CD34+ cells and fetal osteoblastic cell line (hFOB) cells were exposed to 2 Gy or 8 Gy of γ- radiation, respectively. miRNA microarray analysis was performed by LC Sciences Co. (Houston, Texas) in triplicate. Significant increases or decreases in miRNA expression in irradiated vs. non-irradiated control samples were strictly cut off at p<0.01. The three columns represent three biological replicates from each sample. Colors represent log2 values from −2.0 to +2.0. Arrows indicate miRNAs that either increased (red) or decreased (green) after radiation. *: miRNA expressed at low levels.

