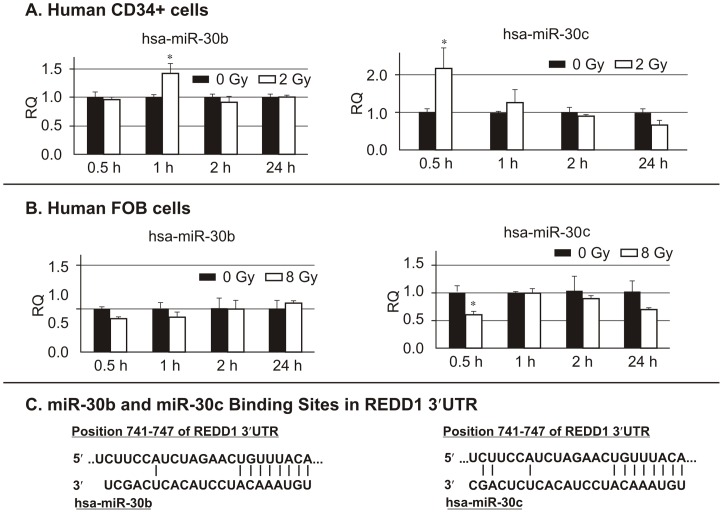
Figure 2. hsa-miR-30 expression after γ-irradiation (Quantitative Real Time-PCR).
CD34+and hFOB cells were collected at 0.5, 1, 2 and 24 h after exposure to 2 or 8 Gy radiation, respectively. miR-30b and miR30c expression were evaluated by RT-PCR. U6 was used as a loading control. miR-30b and miR-30c levels were increased at 0.5 or 1 h after γ-irradiation in (A) CD34+ cells, whereas they were decreased or not altered in (B) hFOB cells in response to radiation. Results represent one of 3 independent experiments. Means ± SD. *, p<0.05. (C) miR-30b and miR-30c binding sites in REDD1 3′UTR are shown. RQ: relative quantification.

