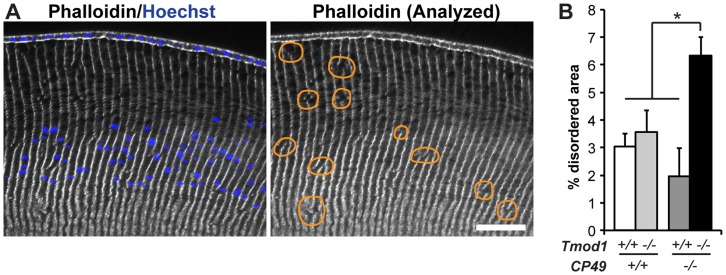
Figure 3. Simultaneous deletion of both Tmod1 and CP49 increases the sizes of disordered fiber cell areas in the lens cortex.
(A) Sample low-magnification images of equatorial cryosections of a 1-mo-old mouse lens. Cryosections were phalloidin-stained for F-actin to reveal columnar fiber cell organization and Hoechst-stained for nuclei to indicate cortical localization. Areas with disrupted radial columns, indicated by discontinuities in vertical F-actin stripes, are outlined with orange lines. Scale bar, 58 µm. (B) Percentage of disordered fiber cell area in the cortex of Tmod1+/+ and Tmod1−/− mouse lenses in both CP49+/+ and CP49−/− backgrounds. The sum of individual areas was normalized to the total analyzed area for each image and region and expressed as a percentage. Error bars reflect mean±SEM of n = 16−18 images/genotype collected from 6 lenses/genotype. *, p<0.05.

