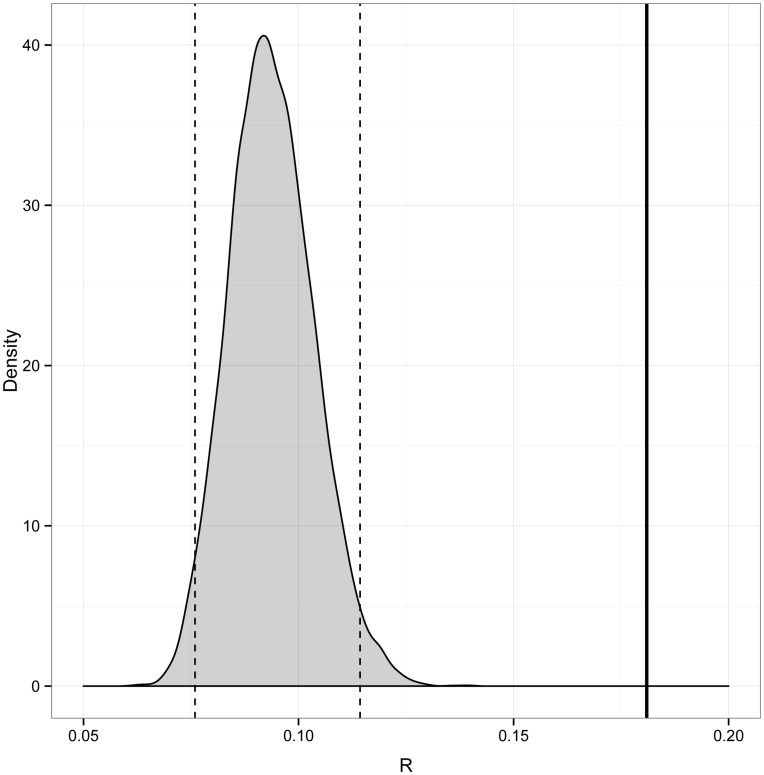
Figure 4. Female-female estimates of relatedness (R).
Mean of mean female-female R (solid line) and simulated means (gray area) with 95% CI (dotted lines). The observed mean is calculated as the mean of the groups’ mean R values. The simulated groups consist of randomly drawn dyads from any of the groups.

