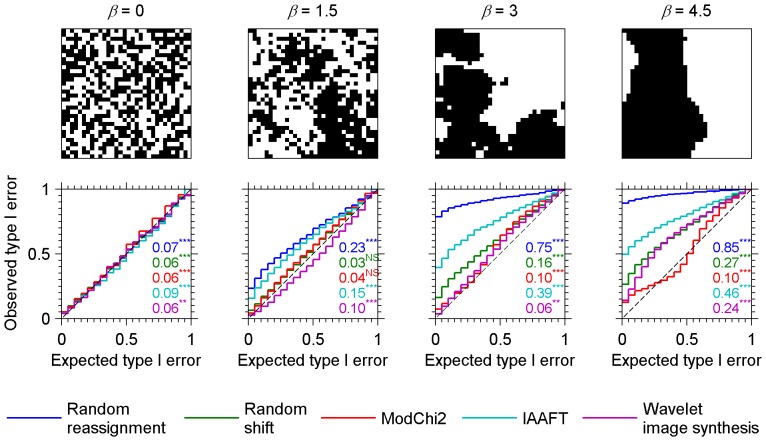
Figure 4. Type I error calibration curves for fractal binary data generated through Fourier synthesis and thresholding of 32×32 pixels images.
[27] . Observed versus expected type I error probabilities resulting from an independence tests on 1000 pairs of simulated images, are plotted for every combination of method (colour curves) and degree of spatial autocorrelation (panels) as measured by the energy spectrum exponent, β. Methods compared are random reassignments, random shifts, modified chi-square test of Cerioli (ModChi2), iterative amplitude adjusted Fourier transform (IAAFT), and wavelet-based image synthesis. Each bin is 0.05 wide. The Kolmogorov-Smirnov (K.-S.) maximum difference statistic which measures the departure from the line of identity (dashed line) is indicated for each curve along with results of the derived test of the departure: *** = p-value<0.001; * = 0.01≤p-value<0.05; NS = not significant.

