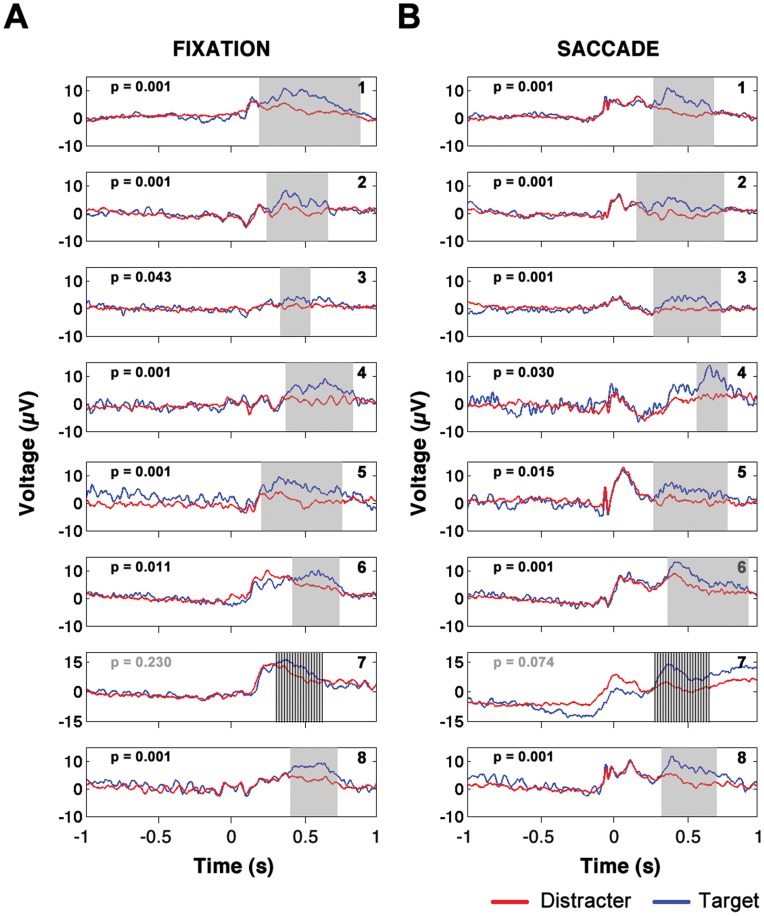
Figure 2. Individual subject saccade and fixation P3s.
Plot of mean activity of electrodes in significant clusters of target minus distracter positivity for fixation trials (left column) and saccade trials (right column). Mean time course of target trials is plotted in blue and mean time course of distracter trials is plotted in red. Note that the EP waveforms are averages over all electrodes that showed significant target minus distracter positivity at any time points over the whole time window in which significant target minus distracter differences were observed. Time is measured relative to image presentation (fixation condition) or relative to saccade landing (saccade condition).

