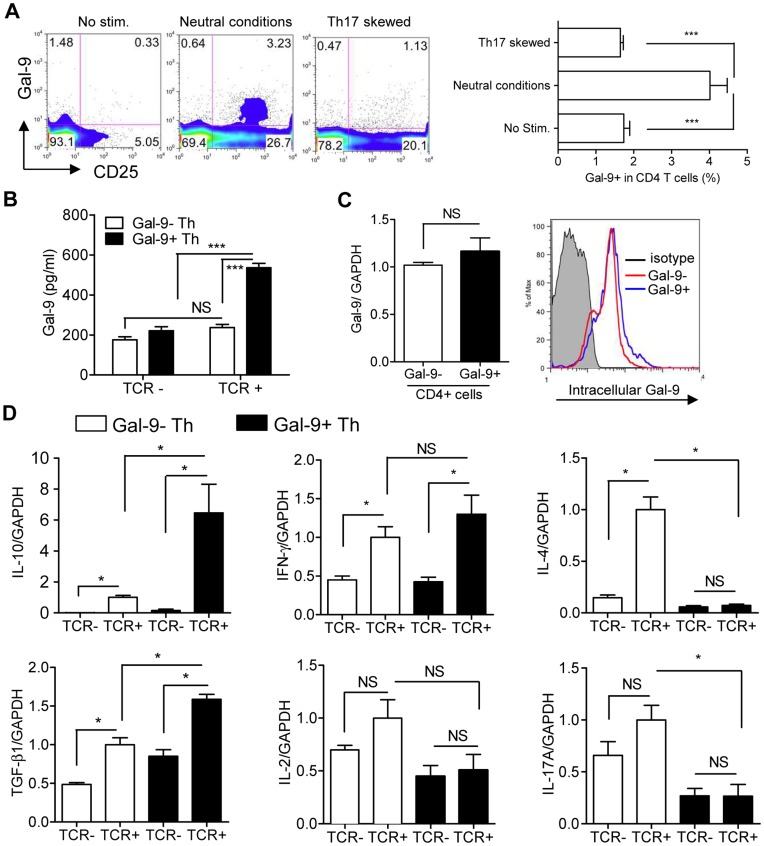
Figure 2. Identification of Gal-9+ Th cells.
(A) Naïve CD4 T cells were cultured as in Figure 1A , and cell-surface Gal-9 expression was monitored using flow cytometry. (B) Naïve CD4 T cells were sorted into Gal-9+ Th and Gal-9− Th cells with a cell sorter and cultured under TCR stimulation or left unstimulated for 4 days before Gal-9 secretion into the culture media was measured. (C) Gal-9+ Th and Gal-9− Th cells cultured under TCR stimulation for 4 days were examined for Gal-9 mRNA expression (left) and intracellular Gal-9 protein expression (right). (D) Cytokine mRNA expression in Gal-9+ Th and Gal-9− Th cells cultured with or without TCR stimulation for 4 days. All the results are shown as the mean ± SEM of quadruplicates. p<0.001 (***), p<0.05 (*), not significant (NS). Representative data out of at least 2 experiments are shown.

