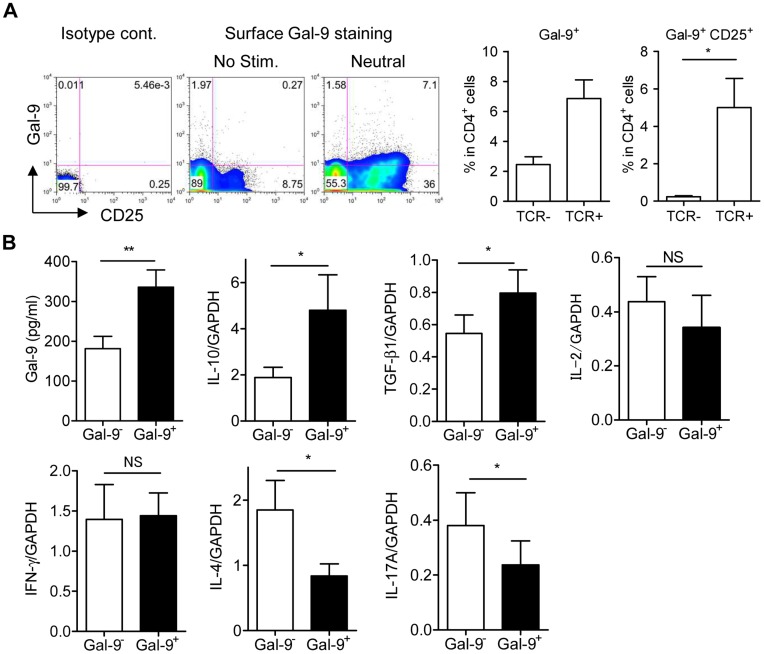
Figure 6. Gal-9+ Th cells in humans.
(A) CD4 T cells from human peripheral blood were cultured with or without TCR stimulation for 4 days. Surface Gal-9 and CD25 expression was analyzed using flow cytometry. Results are shown as the mean ± SEM from 4 healthy donors. (B) CD4 T cells were cultured under neutral conditions for 4 days and then sorted into Gal-9+ CD25+ Th cells and Gal-9− CD25+ Th cells. Sorted cells were cultured under neutral conditions for 4 days before the measurement of secreted Gal-9 by ELISA or cytokine mRNA using real-time RT-PCR. Results are shown as the mean ± SEM from 8 healthy donors. * p<0.05. Data from 2 representative experiments are shown.

