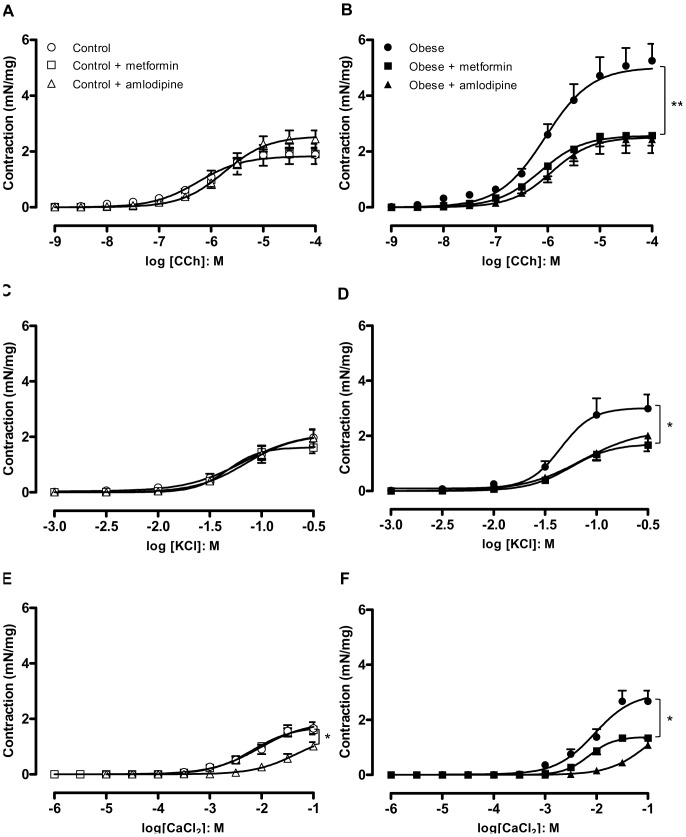
Figure 4. Cumulative concentration-response curves to carbachol (A and B), KCl (C and D) and CaCl2 (E,F) in detrusor smooth muscle from lean and obese mice chronically treated with metformin (300 mg/kg/day, 14 days) or amlodipine (25 mg/kg/day, 21 days).
Data represent the mean ± SEM for 5 to 11 mice each group. * p<0.05, ** p<0.01 compared with untreated group.

