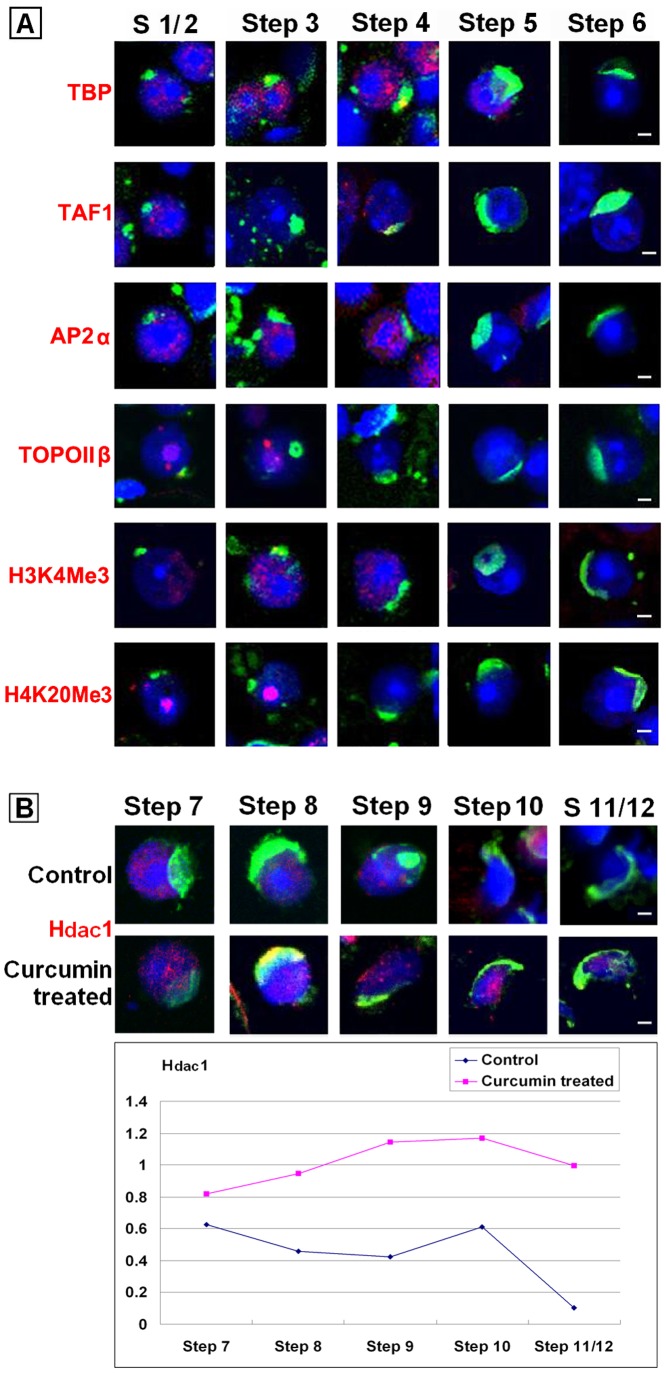
Figure 6. Representative patterns of chromatin associated factors expression in spermatids treated with 50 µM Curcumin for 48.
h. (A). Immunostaining of TBP, TAF1, AP2α, TOPOIIβ, H3K4Me3 and H4K20Me3 in Curcumin-treated spermatids. Red: Signals of given target. Green: Acrosomes highlighted with lectin PNA. Blue: Nuclei counterstained by Hoechst 33342. Bars = 5 µm. (B). Immunostaining of Hdac1 in Curcumin-treated spermatids. Red: Signals of given target. Green: Acrosomes highlighted with lectin PNA. Blue: Nuclei counterstained by Hoechst 33342. Bars = 5 µm. The quantitative analysis of Figure 6 was listed in Table S3.

