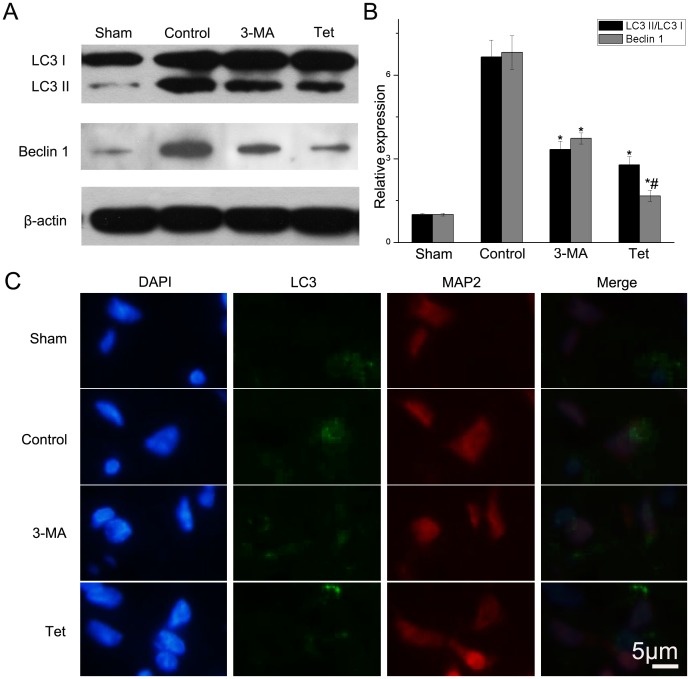
Figure 1. Tetracycline inhibiting the protein levels of LC3 and Beclin 1.
(A) LC3 and Beclin 1 in brain tissues detected by western blotting using β-actin as loading control. (B) Relative density of LC3 II/LC3 I and Beclin 1. (C) LC3 detected by immunofluorescence. Scale bar = 5 µm. Bars represent mean±SD (n = 6); *P<0.05 vs. control group, #P<0.05 vs. 3-MA group.

