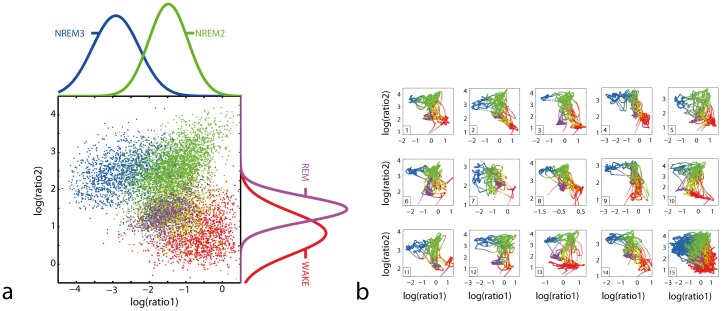
Figure 1. Conserved topography of the sleep state space.
(a) Summary scatter plot of all sleep states for 14 subjects mapped in a 2-dimensional state space. Each 5s EEG epoch (raw data) is represented by 2 different frequency ratios plotted on log/log axes. Ratio1 = (8.6 to 19.3 Hz)/(1.0 to 10.9 Hz), Ratio2 = (11.5 to 20.3 Hz)/(17.9 to 31.5 Hz). Colour coding of the clusters is based on expert scoring for WAKE (red), NREM stage 1 (yellow), stage 2 (green), stage 3 (blue), and REM sleep (magenta). Projections of the 2d-probability density distributions are plotted for NREM stage 2 and stage 3 (top edge, ratio1) and WAKE and REM sleep (right edge, ratio2). For better visibility, the figure shows 10% of all data after applying a running window average (6 point-Hann Window) on the raw data to filter for short-term fluctuations. (b) Individual sleep trajectories are shown for each subject separately (panel 1–14) and cumulated for all individuals (panel 15, bottom right). Sleep trajectories are smoothed (50 point-Hann Window) for better differentiation of stable (clusters) and transitional sleep states (trajectories). Colour coding is as described in (a).

