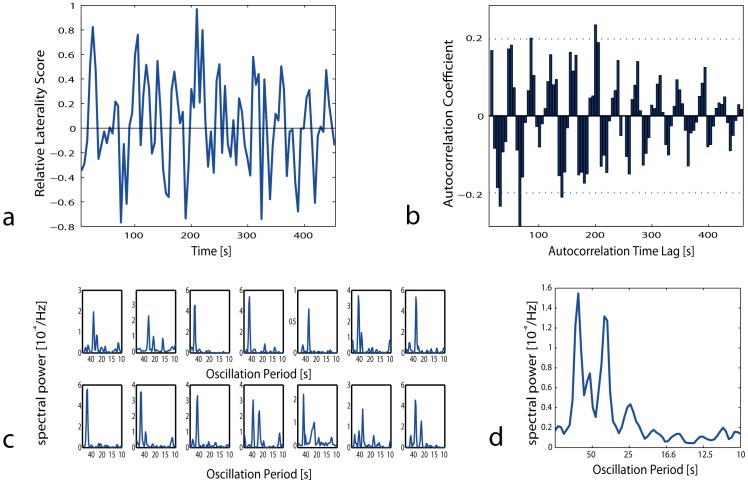
Figure 4. Laterality Analysis of REM sleep.
(a) Time series data of relative laterality of velocity in corresponding central electrodes (C3 vs C4) for 100 successive REM sleep epochs for one individual. (b) Sample autocorrelation of the same period as shown in (a) demonstrating a stable oscillation with a period of about 40s. Approximate 95% confidence measures for the hypothesis of uncorrelated white noise are indicated by a dotted thin blue horizontal line (p = 0.05, N = 100). (c) Fourier analysis (FFT) of REM sleep autocorrelations as in Figure 4b during one selected REM sleep bout for each subject. (d) Mean spectral analysis of REM sleep autocorrelation of all 14 subjects.

