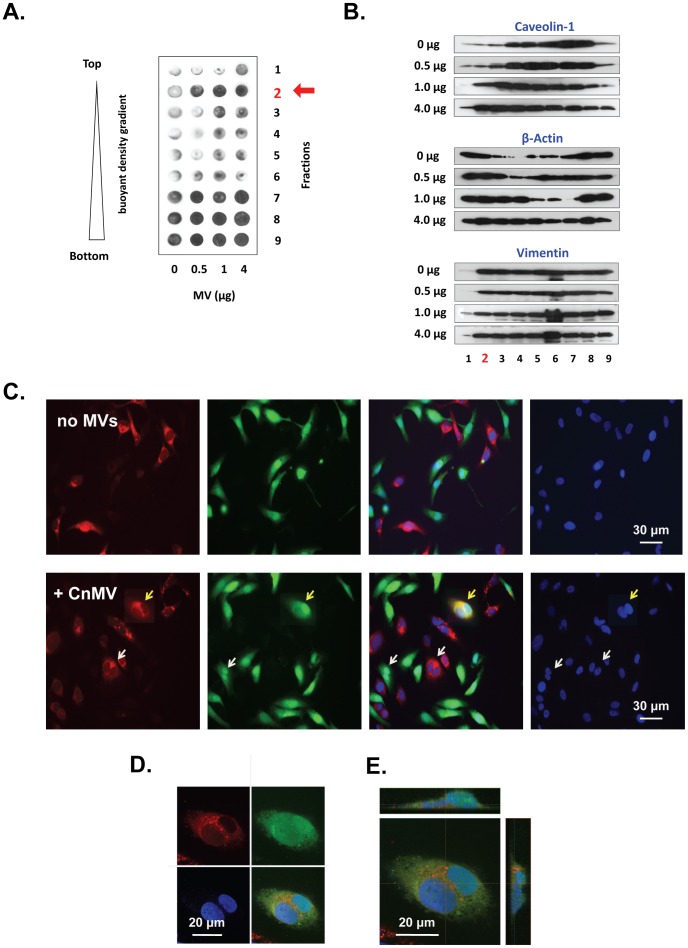
Figure 4. Effect of CnMVs on lipid raft activation and fusion of HBMECs.
HBMECs were treated with PBS or purified CnMVs (0.5, 1, or 4 µg) for 2 h. The cells were lysed in a buffer containing 1% Triton X-100 on ice, and the cell lysates were fractionated in Optiprep™ gradients. Nine fractions were collected. The lipid raft fractions were located in Fraction 2, indicated by a red arrow. An equal volume of each sample was analyzed by dot blots with antibody against CD44 (A) or protein blots with antibodies against caveolin-1, β-actin, and vimentin (B). For cell fusion studies, D54GM cells were treated with the Celltracker red dye CMTPX (1st panel) or the green dye CMFDA (2nd panel) and then incubated with 10 µg purified CnMVs. Syncytial cells were detected after 6 hours of co-culture and displayed a bright yellow signal (yellow arrow) (C). Images shown in (D) are a confocal microscopic section with split images: CMFDA dye (green), CMTPX dye (red), DPAI (blue), and the overlaid image (D). Images shown in (E) are a confocal image with a top and two side views.

