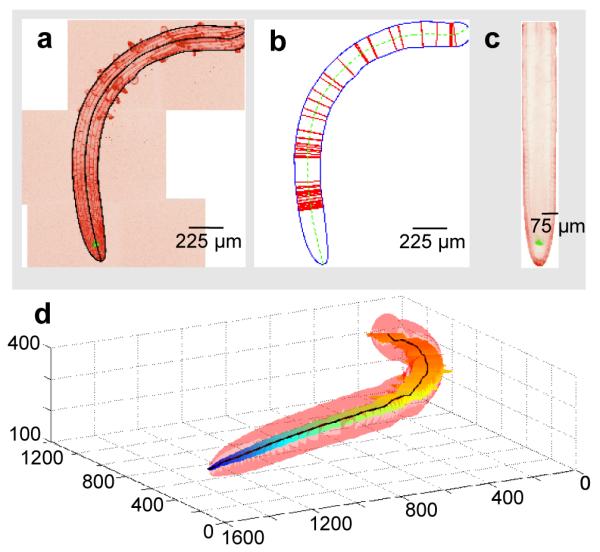
Figure 3.

Computation of the medial section of a plant root. (a) A false-colored image shows the maximum projection of a stitched 3D high resolution image. Black lines indicate the computed border and medial axis of the root. (b) Extracted root, with sampling points used in the computational straightening marked as red lines. (c) A computed straightened medial section of the same root. (d) A 3D plot of the identified root (in pink), the medial section (with a heat map indicating depth from the well surface), and the medial axis (black line). The range of depth covered by this root is approximately 160 microns; this root thus spans half of the depth of the RootArray growth chamber.
