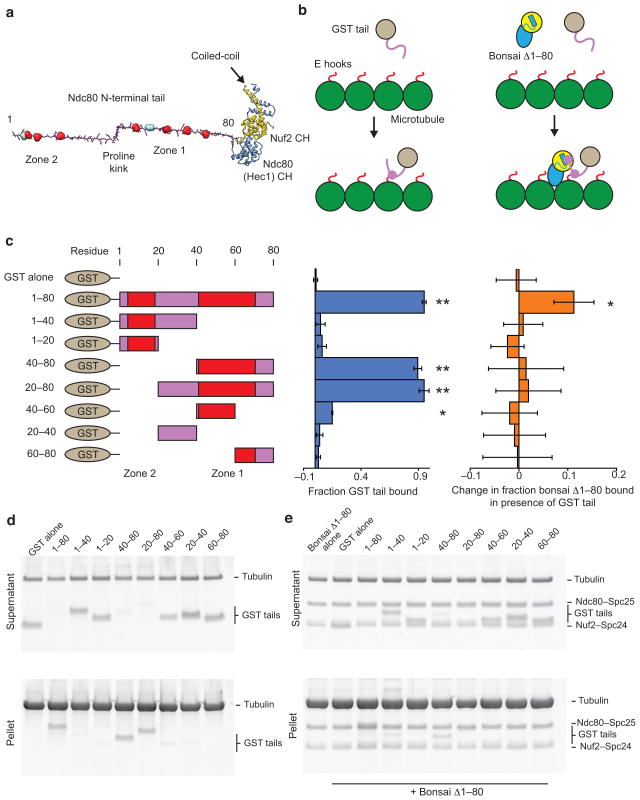
Figure 1. The Ndc80 tail interacts with both the Ndc80c head and tubulin.
(a) Structural model of the Ndc80c’s two-part microtubule binding module. The tail is modeled as an extended polypeptide colored in magenta. Aurora B sites are shown in space-filling representation: red sites were investigated in this study, while teal sites were not (see text). Kinks correspond to the positions of prolines. Ndc80’s CH domain is colored in blue and Nuf2’s in yellow. (b) Cartoons outlining the experiments presented in panels c–e. GST is grey, Ndc80 tail, magenta, tubulin, green, tubulin C-terminus (E hook), red. The Ndc80 head is colored and displayed in the same orientation as in A. (c) Left, legend of the constructs tested. Zones of Aurora B sites are indicated in red. Middle, quantification of d. Error bars represent s.d., n = 3. Double asterisk, P < 0.0015, single asterisk, P = 0.008, t-test vs. GST alone control. Right, quantification of e. Error bars represent s.d., n = 4. Single asterisk, P = 0.012, t-test vs. bonsai Δ1–80 alone control. For all co-sedimentation assays n represents technical replicates. (d) SDS-PAGE of microtubule co-sedimentation assays with GST tail constructs. Tubulin, 3 μM, GST tails, 1 μM. (e) SDS-PAGE of microtubule co-sedimentation assays with bonsai Δ1–80 in the presence of GST tail constructs. Tubulin, 3 μM, bonsai Δ1–80, 0.5 μM, GST tails, 1 μM.

