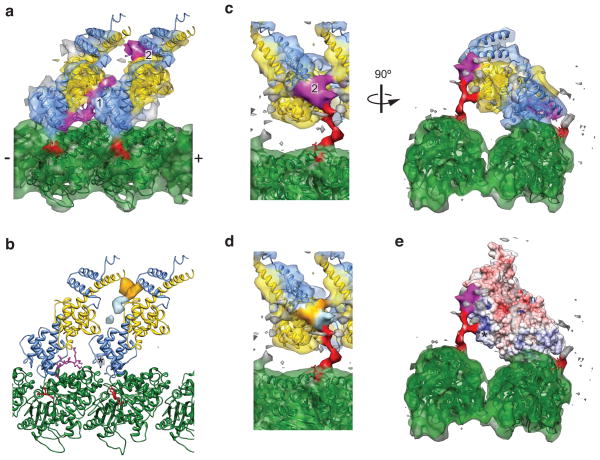
Figure 5. Structural analysis of the Ndc80c–microtubule interface.
(a) Crystal structures of two bonsai Δ1–80 molecules (PDB 2VE7) and tubulin (PDB 1JFF) docked into the improved cryo-EM density map, colored as in Fig. 1a. Two densities not occupied by the crystal structures (magenta) were interpreted as corresponding to ordered regions of the N-terminal tail. (b) Positive difference density for reconstructions of wild-type bonsai minus either bonsai Δ1–40 (orange), or bonsai 4D (light blue), contoured at 3.5σ. The asterisk indicates a spurious density peak in the bonsai 4D difference map from the processing procedure (see Online Methods). (c) Same as a, but with the cryo-EM map displayed at a lower threshold, where the tubulin E hook (red) is visualized. (d) Same view as c, left panel, colored according to the locations of an ordered portion of residues 1–40 (orange), and the tubulin-binding portion of zone 1 (light blue). (e) Same view as c, right panel, displaying an electrostatic surface potential map of the bonsai Δ1–80 crystal structure, contoured at +/− 10 kT/e. Asterisk indicates the positive patch on the Nuf2 CH domain that interacts with the E hook of tubulin.

