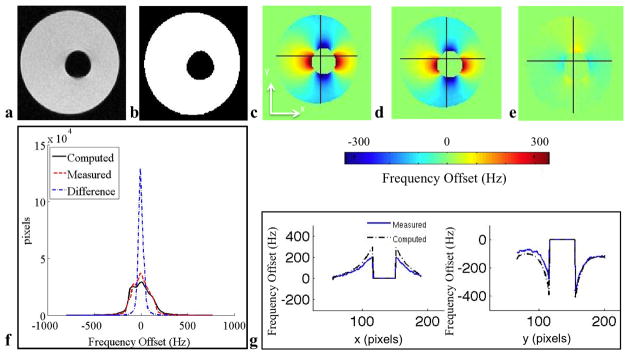
Figure 1.
This phantom with large susceptibility variations demonstrates the dipole shaped inhomogeneity and the accuracy of the model. a: Coronal IDEAL-SPGR MRI in-phase image. b: Binary mask showing water (white) and air (black). c: Computed field map. d: Measured field map. e: Difference map between measured and computed field maps. f: Histogram of ΔB0 values within the tissue of the measured, computed and difference field maps. g: Horizontal (x) field map traces and vertical (y) field map traces showing substantial agreement between the computed and measured field maps. The absolute error between the computed and measured field map is 16 Hz. The 80% distribution widths of the histograms of the computed, measured, and difference field map histograms inside the mask are 230 Hz, 222 Hz, and 52 Hz, respectively.

