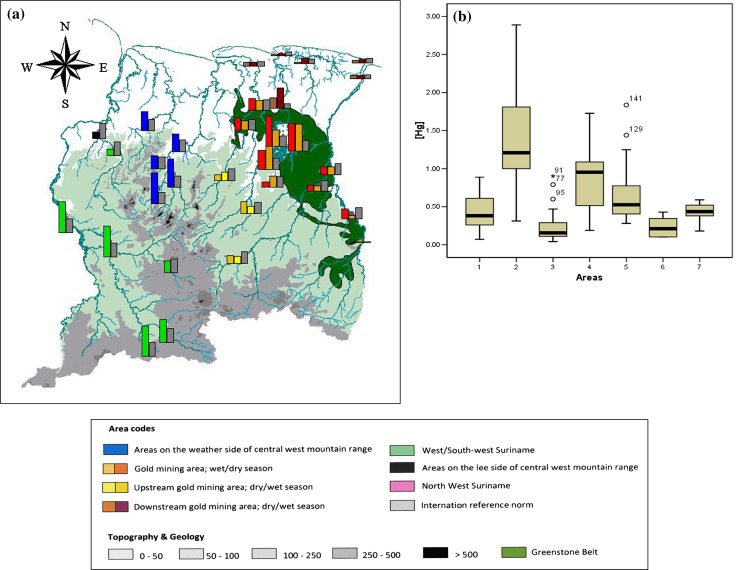
Fig. 3.
a Average mercury levels found in piscivorous fishes in different river systems in Suriname; Gray bars represent the European Union standard for human consumption of 0.5 μg g−1. b Boxplot showing the distribution of mercury levels in piscivorous fishes, measured in different areas. Codes for areas: 1 GMA, 2 Brokopondo Reservoir (BR), 3 UGMA, 4 PWS, 5 WSW, 6 DGMA, 7 PLS

