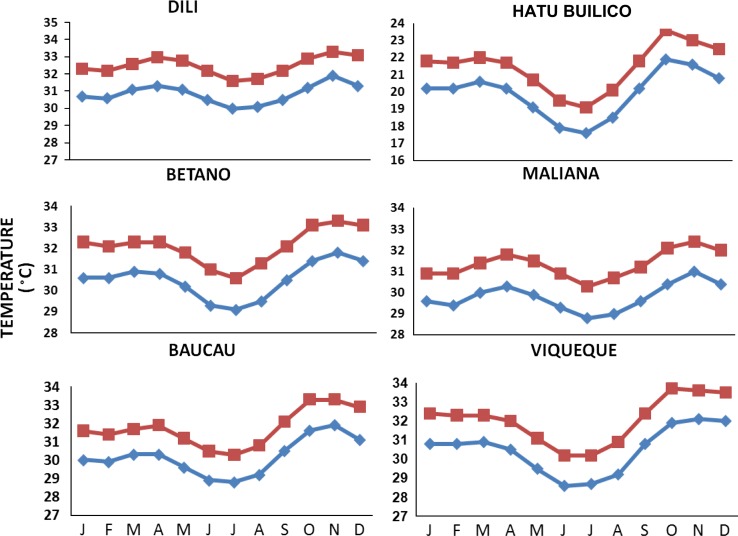
Fig. 5.
The current (~1950–2000) mean monthly temperatures interpolated from the WORLDCLIM database (blue symbols and lines) and mean monthly temperatures predicted for 2050 (red symbols and lines) for six sites in Timor Leste at different locations and elevations. The 2050 predicted values are for the A2A scenario of the CSIRO model in the WORDCLIM database (www.worldclim.org/futdown.htm)

