Fig. 6.
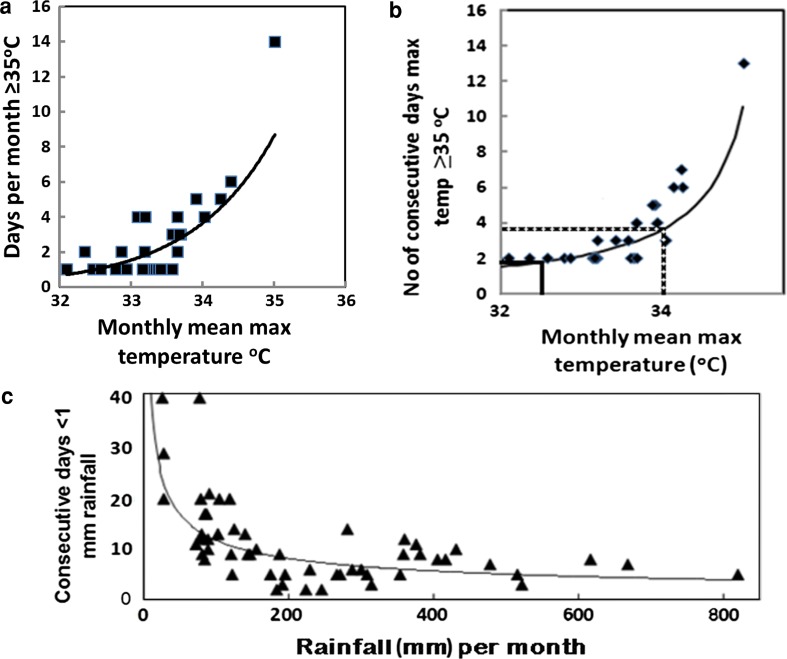
Number of days per month ≥35 °C (a) and consecutive days ≥35 °C per month (b) as a function of the mean monthly maximum temperature, and measured number of consecutive days ≤1 mm per month in the rainy season as a function of mean monthly rainfall (c) for locations in Timor Leste where more than 20 years of data (1954–1974) are available. The fitted exponential regressions are shown as solid curves. The days ≥35 °C and the number of consecutive days ≥35 °C for the current mean temperature (32.5 °C—solid line) and that predicted for 2050 (34 °C—dashed line) for the sites where measurements were obtained are shown in a and b. Consecutive days were calculated across month boundaries and averaged to give per month numbers of days

