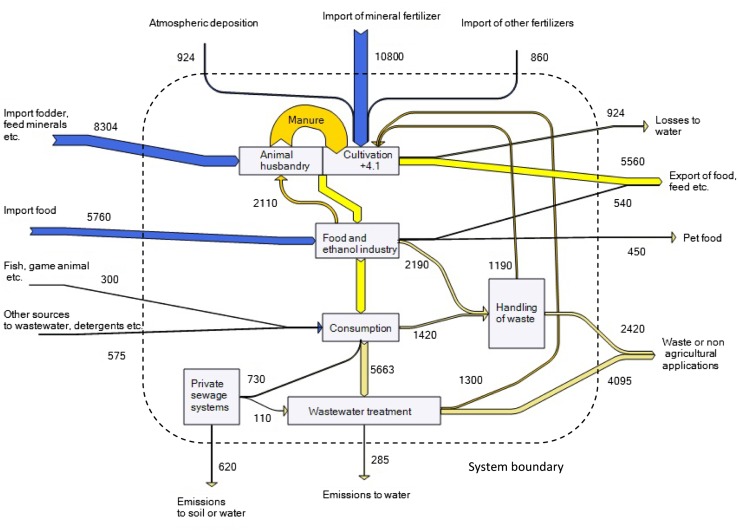
Fig. 1.
Quantified flows in tons of phosphorus in Swedish agriculture and the food chain. Boxes The processes of cultivation, consumption, treatment etc. Stock change in soil is shown in kg ha −1. The width of the arrow corresponds to the size of the flow of phosphorus. When corresponding value is lacking for an arrow the flow is only indirectly calculated from other results in this study

