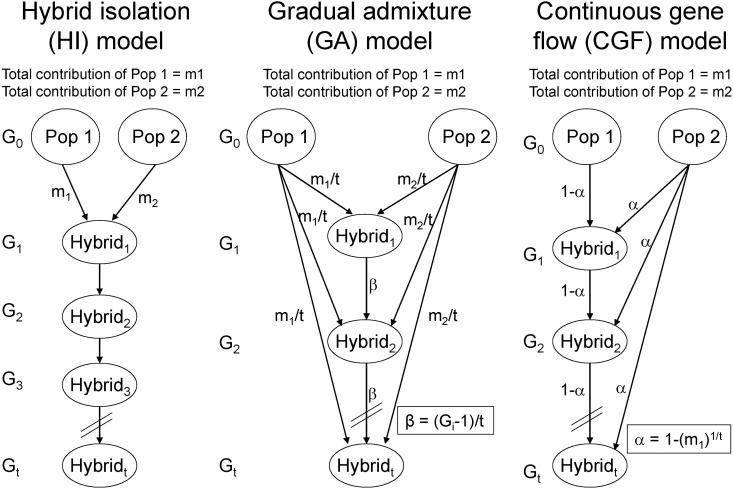
Fig. 3.
Typical admixture models. HI model and CGF model were adapted from Long [49], GA model was adapted from Ewens and Spielman [50]. In each model, the genetic contributions of Pop1 and Pop2 are m1 and m2, respectively. The admixed population experienced Gi generations, which range from 1 to t generations.

