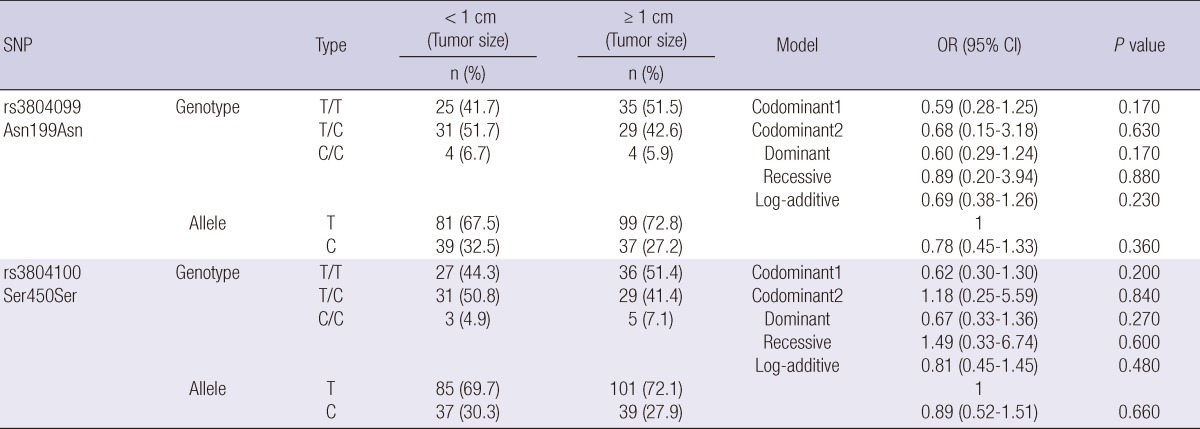
Table 5.
Genotype and allele frequencies of SNPs of TLR2 gene in PTC patients with tumor size < 1 cm and PTC patients with tumor size ≥ 1 cm
The P values were calculated from logistic regression analyses adjusting sex and age (codominant1, A/A vs A/B; codominant2, A/A vs B/B; dominant A/A vs A/B+B/B; recessive, A/A+A/B vs B/B; log-additive, A/A vs A/B vs B/B). Missing data of genotype were excluded for exact analysis. PTC, papillary thyroid cancer; SNP, single nucleotide polymorphism; OR, odds ratio; CI, confidence interval.

