Fig. 1.

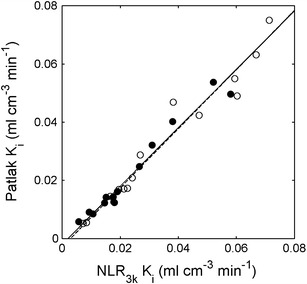
Correlation of Patlak-derived K i versus NLR3k-derived K i at baseline (closed circles, solid line) and post-chemotherapy (open circles, dashed line). The lines are orthogonal regressions.

Correlation of Patlak-derived K i versus NLR3k-derived K i at baseline (closed circles, solid line) and post-chemotherapy (open circles, dashed line). The lines are orthogonal regressions.