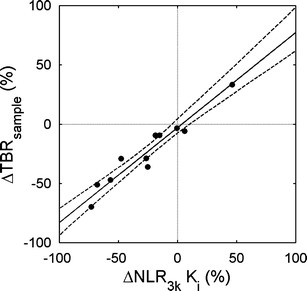
Fig. 5.

Correlation between relative change in TBR versus NLR3k K i, using a blood sample at 55–60 min p.i. for calculation of TBR instead of an ascending aorta VOI. The solid line is an orthogonal regression; the dashed lines show the 95% confidence interval of the regression line.
