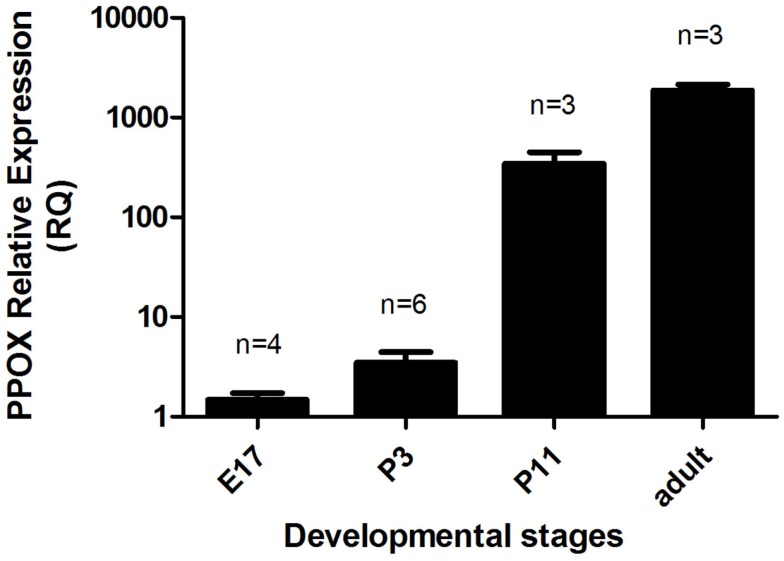
Figure 7.
Relative gene expression of Ppox in the brains of E17 and P3 mice, and in the hypothalamus of P11 and adult males. Error bars represent the standard error. The number of samples per group is indicated above each column. The relative quantity of Ppox in each sample was normalized to the quantity of Tbp.

