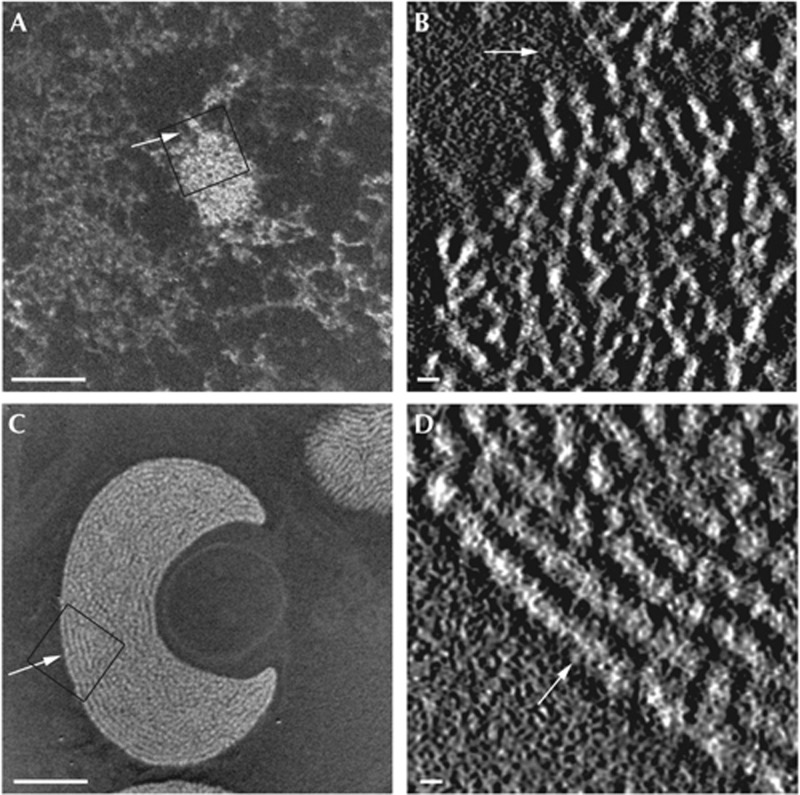
Figure 1.
ESI-tomographic analysis reveals the MEF nucleus is populated exclusively by 10-nm chromatin fibres and is able to detect both 10- and 30-nm chromatin fibres in situ. (A) An ESI phosphorus map of a MEF nucleus, chromatin fibres (white on black background), where all the chromatin fibres are projected onto a single image plane, and (B) central plane of the tomogram generated from this nucleus of an enlarged region of the chromocentre shown in A (box). (C) Phosphorus map and (D) central plane through the tomogram of an entire starfish sperm nuclei. The arrow illustrates rotation between the phosphorus map and the tomogram. Thirty-nanometre chromatin fibres in the field (box) are oriented parallel to the plane of the section. Scale bar, 500 nm in (A,C), and 30 nm in (B,D). ESI, electron spectroscopic imaging; MEF, mouse embryonic fibroblast.

